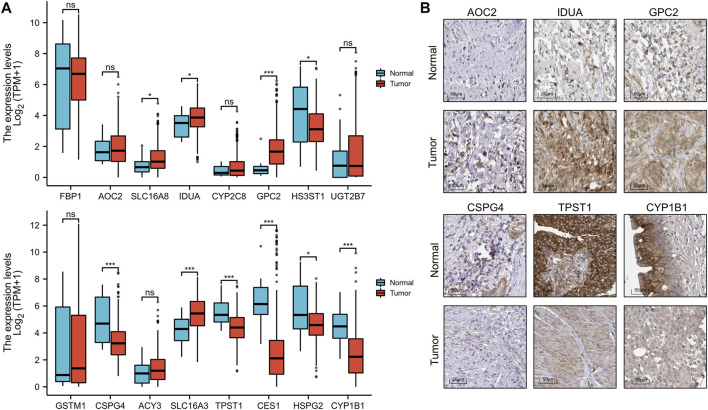
FIGURE 7.
Box plot of the expression difference of 16 genes involved in the prognostic signature between normal and BLCA tissue (A). The expression difference of AOC2, IDUA, GPC2, CSPG4, TPST1, and CYP1B1 between tumor and normal tissue at the protein level according to the Human Protein Atlas (HPA) cohort. (B). *p < 0.05, **p < 0.01, ***p < 0.001.

