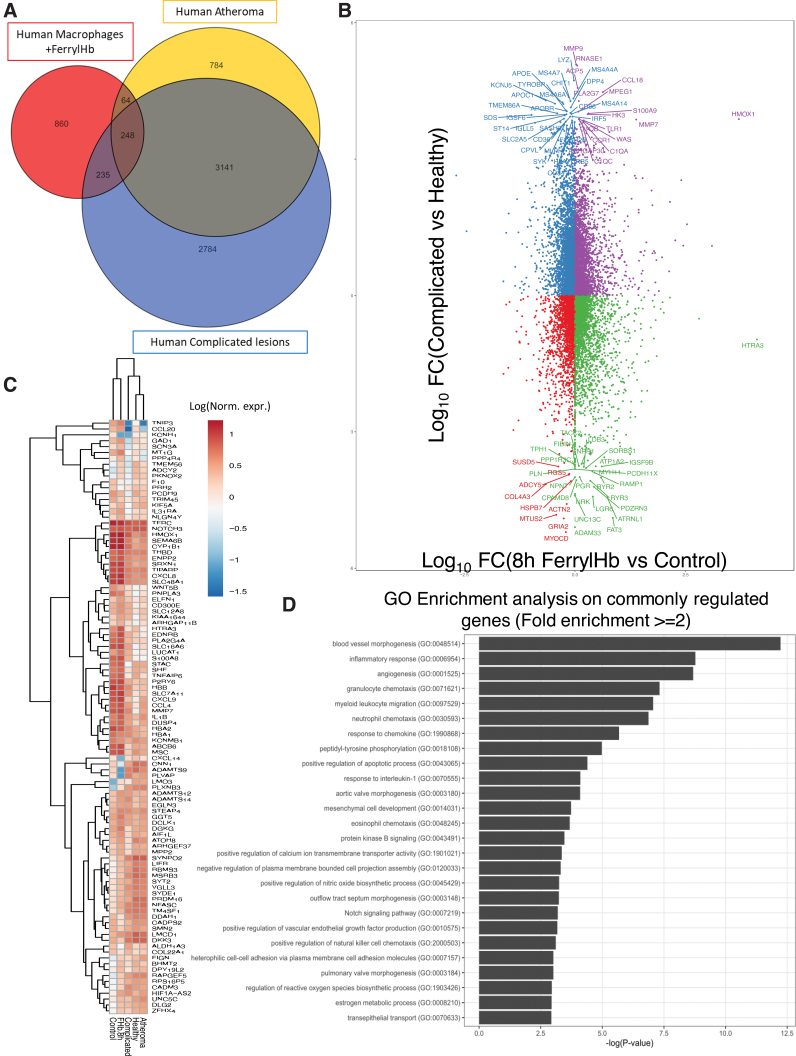
FIG. 16.
Comparative analysis between atherosclerotic lesions and human macrophages exposed to ferryl hemoglobin. (A) Venn diagram depicting the number of DE genes by each group analyzed. Blue circle refers to the number of DE genes in complicated lesions versus healthy samples. Orange circle is associated with the number of DE genes in atheromatous lesions versus healthy samples and red refers to the number of DE genes in human macrophages treated with ferrylHb for 8 h. (B) Scatter plot depicting the number of commonly regulated genes from each group comparison. Y-axis shows the DE genes in the complicated lesion versus healthy sample, and X-axis the human macrophages treated with ferrylHb comparison. Data sets were filtered for logFC >2 and top genes are labeled. (C) Clustered heatmap analysis of genes belonging to the commonly regulated and overlapping gene set (547 genes) from the Venn diagram in Figure 12A. Gene expression levels are displayed as log10 (normalized expression). (D) GO pathway enrichment analysis on common overlapping DE genes in complicated and atheromatous lesions when compared with healthy donors, and human macrophages treated with ferrylHb compared with control. Top pathways are shown with at least twofold enrichment and ranked based on −log(p value). GO, Gene Ontology. Color images are available online.

