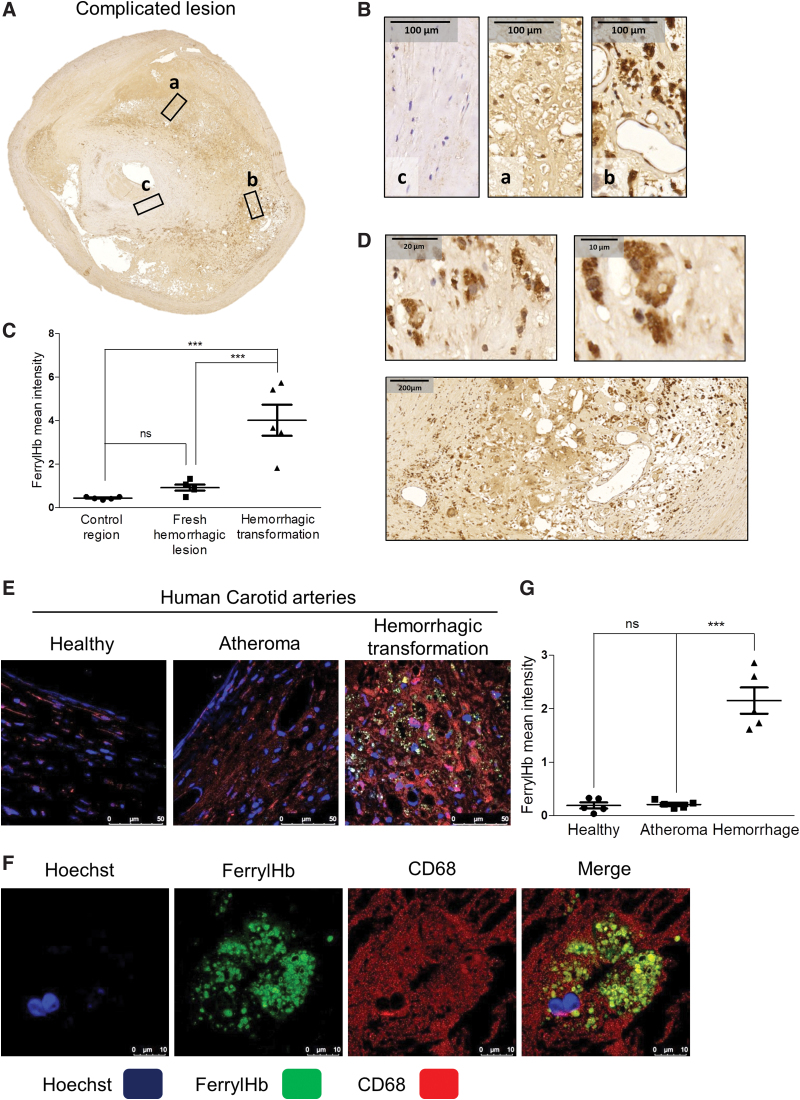
FIG. 5.
Ferryl hemoglobin is characteristic of the hemorrhagic transformed region localized extracellularly and within CD68+ macrophages. (A) Fresh hemorrhagic region (square a), hemorrhagic transformed region (square b), and control region (square c) were demonstrated using ferrylHb immunohistochemistry on complicated lesions. (B) 100 × Magnification images demonstrated FerrylHb positivity of fresh hemorrhagic region (square a), hemorrhagic transformed region (square b), and control region (square c) of complicated lesions. (C) Quantitative analysis of ferrylHb immunohistochemical stainings of tissue sections was performed using ImageJ software (N = 5). (D) Intracellular (upper panels) and extracellular (lower panel) accumulation of ferrylHb is shown in hemorrhagic transformed area. (E) Segmental cross sections of a healthy carotid artery and atheromatous and hemorrhagic transformed lesions were shown. (F) High-magnification images demonstrated macrophages positive for both ferrylHb and CD68 in the hemorrhagic transformed lesions. Sections were stained with Hoechst 33258 for DNA (blue), an anti-ferrylHb antibody with Alexa Flour 488 secondary antibody for ferrylHb (green), and anti-CD68 antibody with Alexa Flour 647 secondary antibody for CD68 (red). Images were taken using Leica TCS SP8 gated STED-CW nanoscopy. Images were deconvolved using Huygens Professional software. Representative image, N = 5. (G) Fluorescence intensity for ferrylHb staining was calculated using ImageJ software (n = 5). Scale bars shown in the images represent 10, 20, 50, 100, or 200 μm. ***p < 0.001. CW, continuous wavelength; ns, not significant; STED, stimulated emission depletion. Color images are available online.

