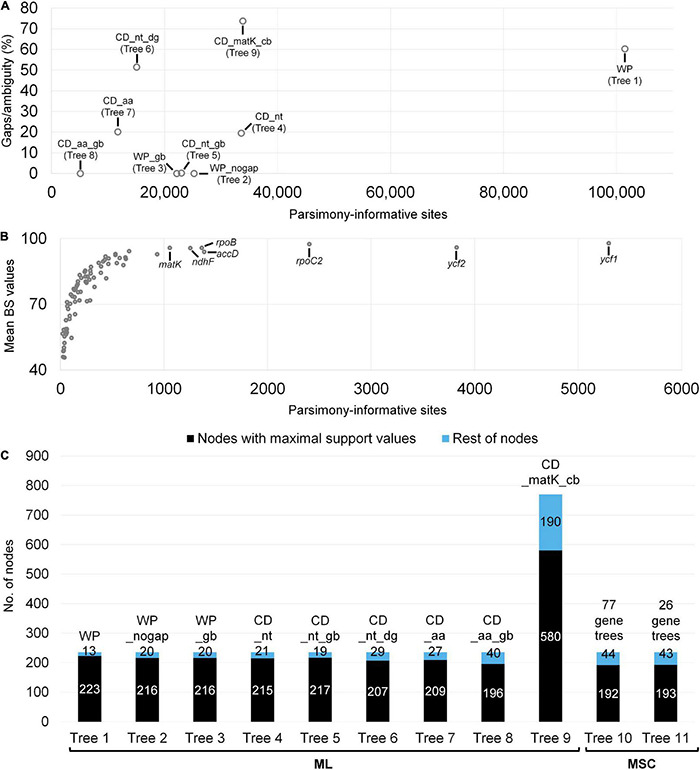
FIGURE 2.

Comparison of datasets used for phylogenetic analyses and their resolution in resulting trees. Descriptions for these datasets provided in Table 1. (A) A scatter plot showing differences in number of parsimony-informative sites (PIS) and gap/ambiguity among datasets for maximum likelihood (ML) analysis. (B) A scatter plot showing PIS and mean bootstrap values (BS) of 77 individual gene trees that were used for the multispecies coalescent (MSC) approach. The top seven protein-coding regions (including matK) with PIS (>1,000) are indicated. (C) A comparison of tree topology resolutions. Values within the histograms indicate the number of nodes. Maximal support values are BS = 100 or local posterior probability = 1.0.
