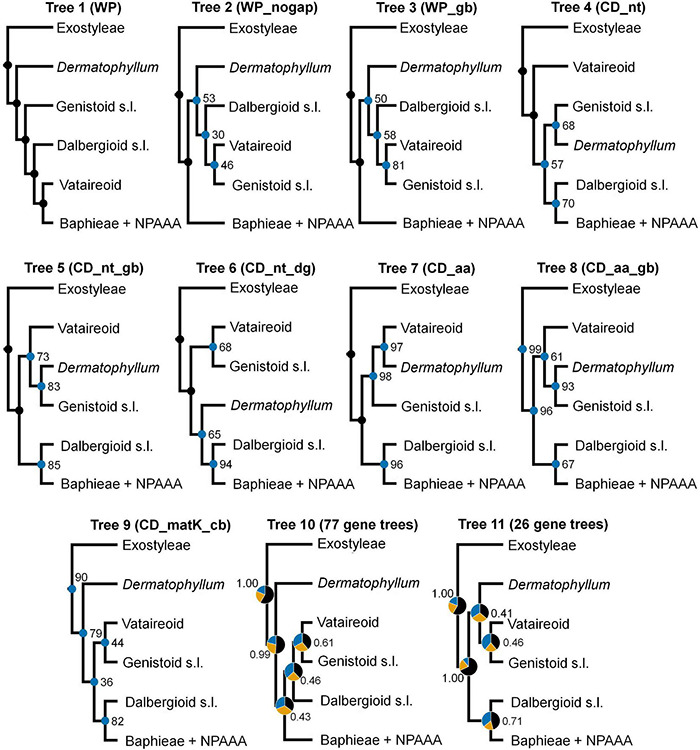
FIGURE 4.

Differences in topology and support values for the 11 trees with respect to resolving the phylogenetic relationships among the Vataireoid, Dermatophyllum, Genistoid s.l., Dalbergioid s.l., and Baphieae + NPAAA (non-proteinogenic amino acid accumulating) clades. Nodes with maximal bootstrap support (100) are denoted as black dots, while other nodes are marked with blue dots with values in nine trees (Trees 1–9). In Trees 10 and 11, based on the multispecies coalescence approach, pie charts representing quartet score values of topologies (black = main, orange = first alternative, blue = second alternative) and local posterior probability are presented at nodes.
