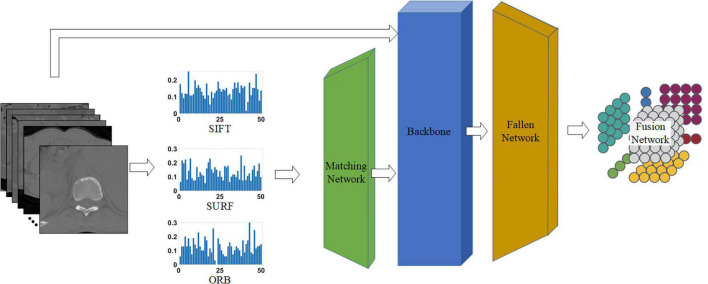
FIGURE 4.
Proposed network for classifying tuberculosis images. The middle three histograms are the SIFT, SURF, ORB vectors with length of 50 extracted from raw CT images, and the green, blue, and orange block represent the matching network, backbone, and fallen network, respectively. The matching network and fallen network are illustrated in Figures 5A,B, respectively, and the last block is the fusion network, which is illustrated in Figure 5C.

