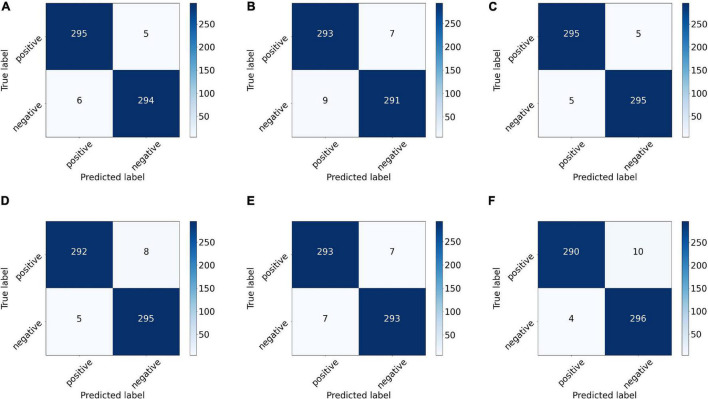
FIGURE 8.
Confusion matrix of the proposed network with different backbones: (A) ResNet-18, (B) ResNet-50, (C) VGG-11, (D) VGG-16, (E) DenseNet-121, and (F) DenseNet-161. The number on each sub-block represents the number of predictions, and the bars on the right of each block represent the heat value chart of the predicted numbers.

