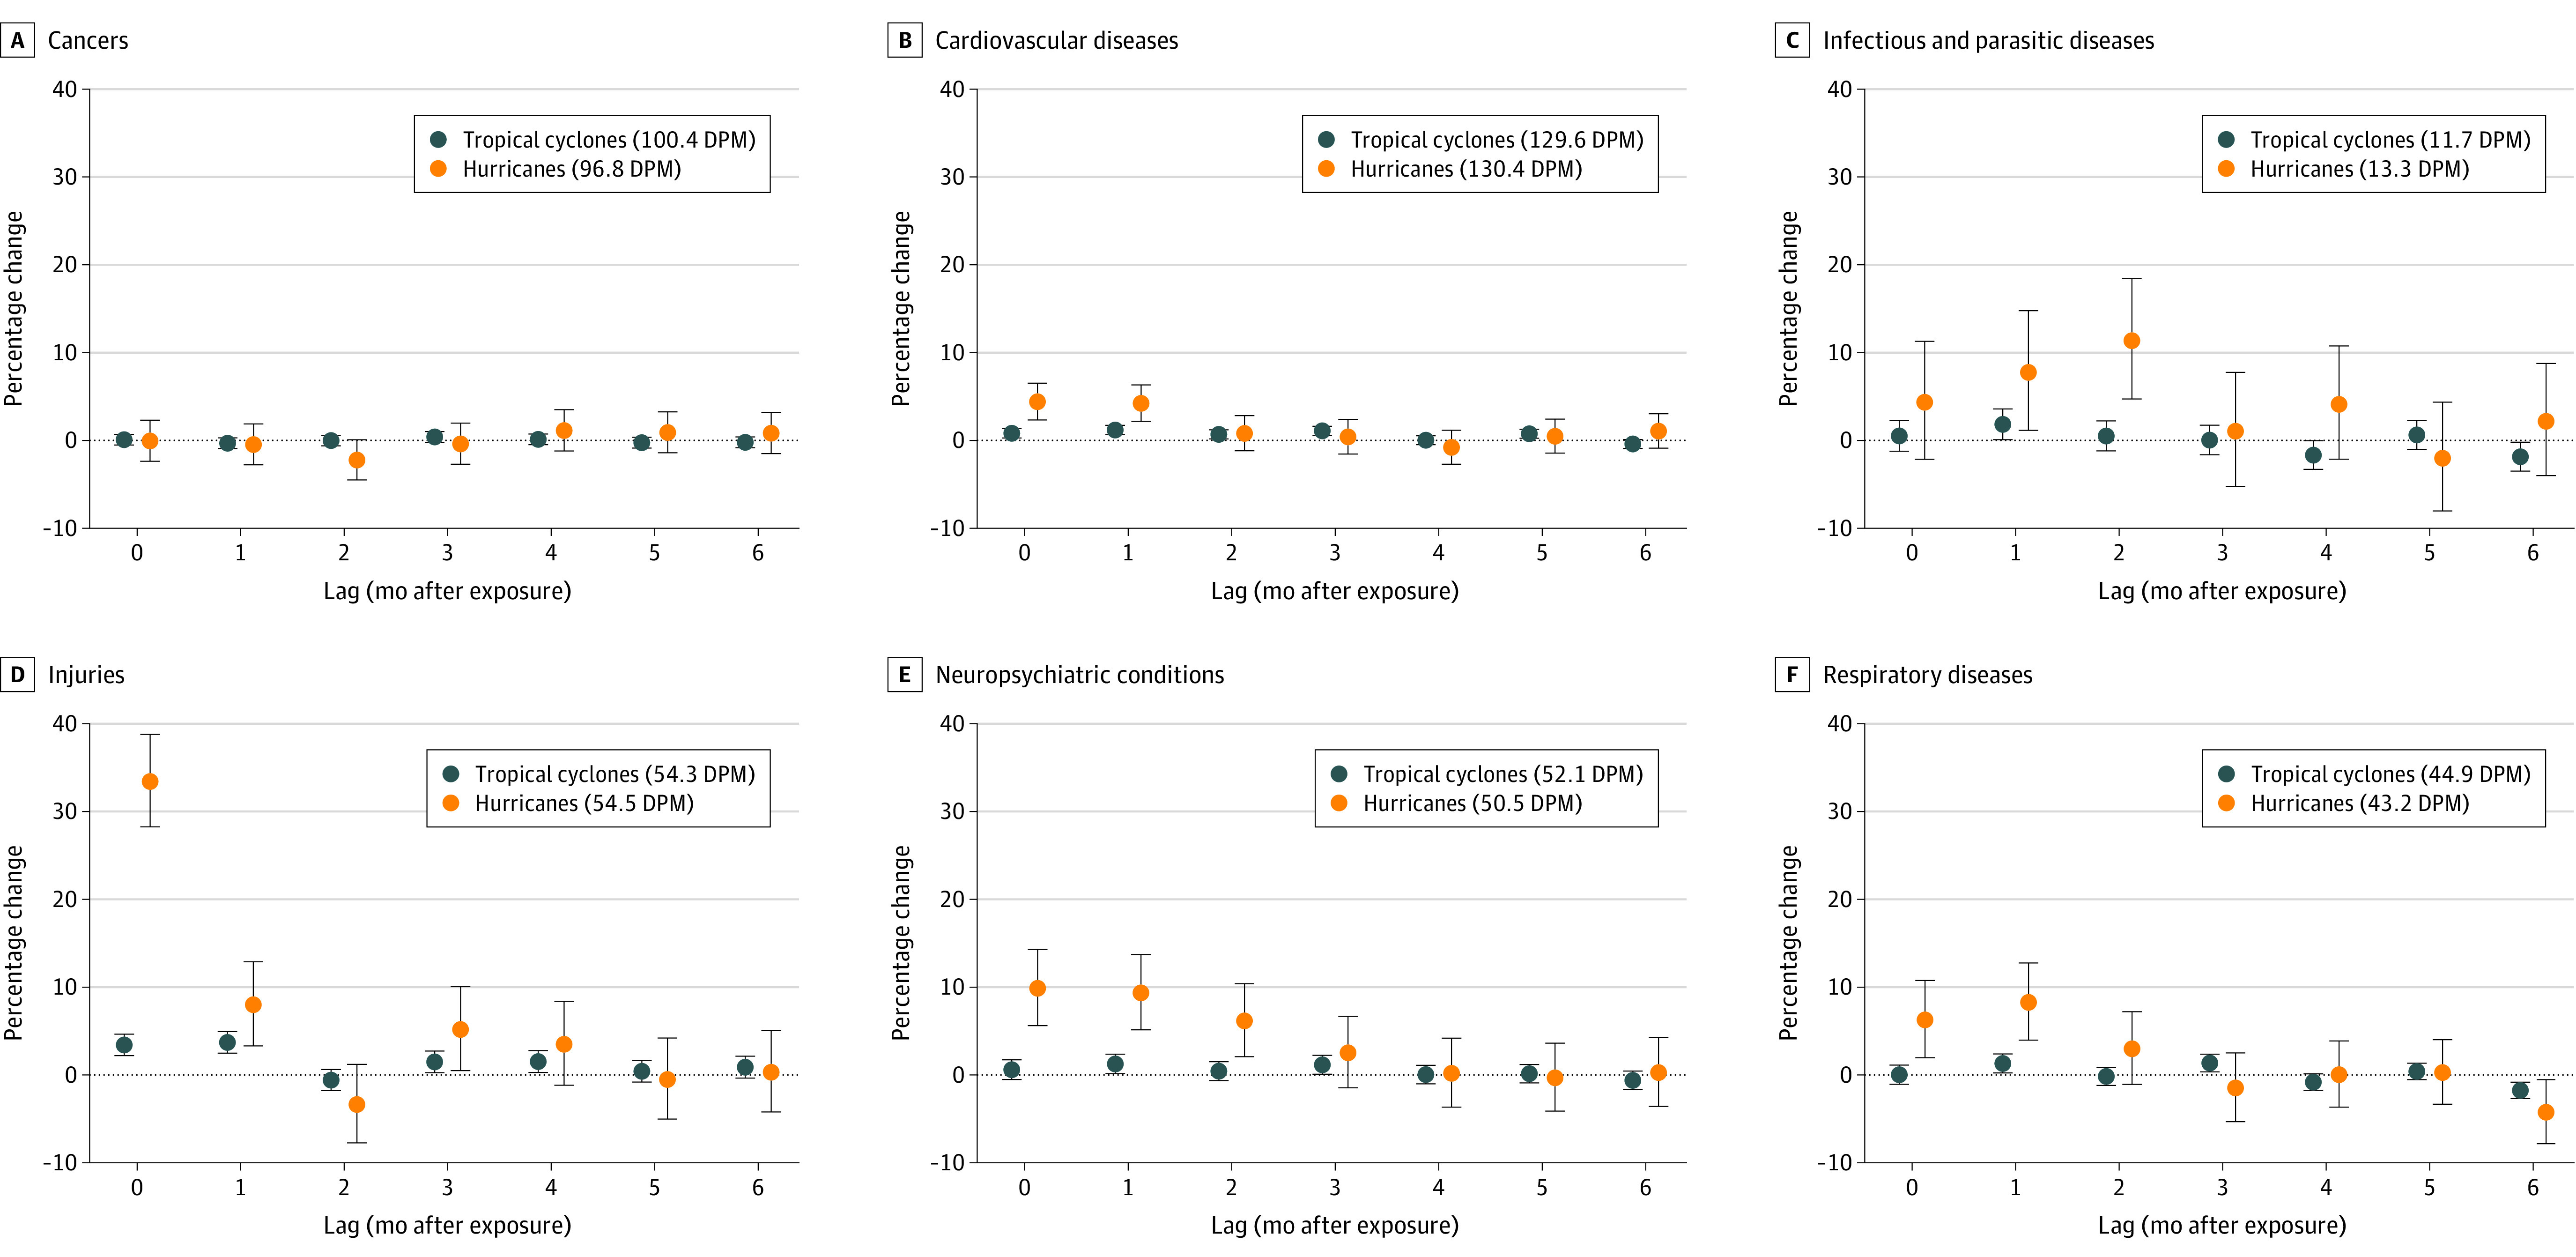
Figure 2. Percentage Change in Death Rates per 1-Day Increase in Monthly Tropical Cyclone or Hurricane-Only Exposure by Cause of Death, and Lag Time.

Dots indicate point estimates; whiskers, 95% credible intervals. Values in parentheses indicate overall deaths per 1 000 000 for 2018 monthly age-standardized median rate (DPM). Pneumonia-type deaths were classified as respiratory diseases.
