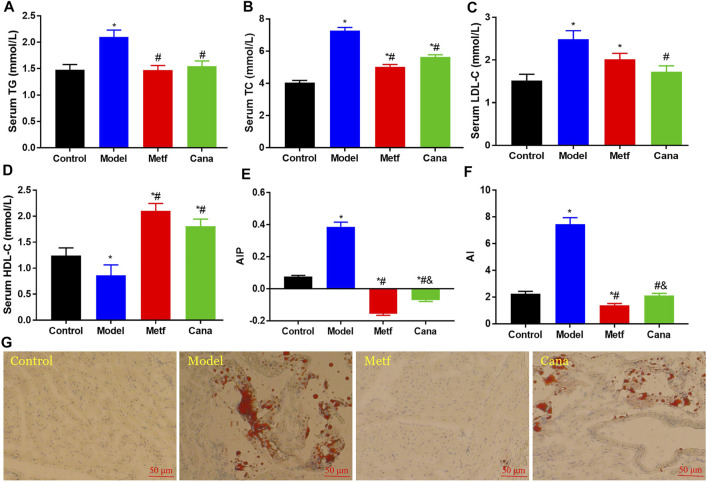
FIGURE 1.
Effects of canagliflozin (Cana) on lipid profile in type 2 diabetes mellitus (T2DM) mice. Triglyceride (TG) (A), total cholesterol (TC) (B), low-density lipoprotein cholesterol (LDL-C) (C), and high-density lipoprotein cholesterol (HDL-C) (D) levels in serum. Atherogenic index of plasma (AIP) (E), calculated by lg(TG / HDL-C). Atherogenic index (AI) (F), calculated by (TC − HDL-C) / HDL-C. Cardiac tissues with Oil Red O staining (G). Data are expressed as mean ± SEM. & p < 0.05, the Cana group compared with the Metf group; # p < 0.05, compared with the model group; *p < 0.05, compared with the control group. Six mice in each group were randomly selected, and statistical analyses were performed.

