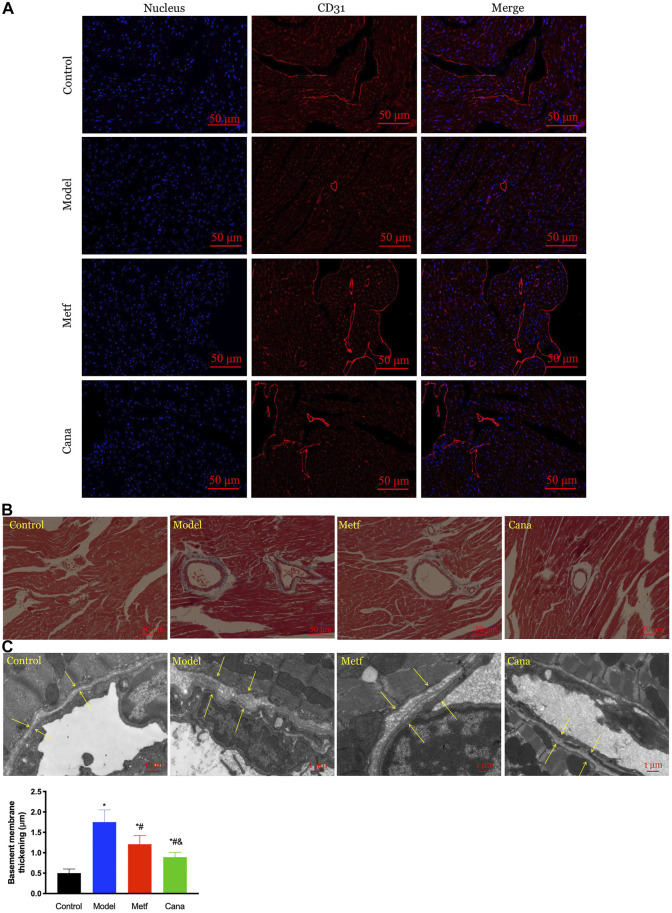
FIGURE 3.
Effect of Cana on cardiovascular abnormalities in T2DM mice. The expression of cluster of differentiation 31 (CD31) in cardiac tissues (A), immunofluorescence staining for CD31 (red), and nucleus (blue), scale bar: 50 μm. Masson’s trichrome staining in cardiac tissues (B), scale bar: 50 μm. Changes in vascular basement membrane observed by transmission electron microscope (TEM) (C), scale bar: 1 μm. & p < 0.05, the Cana group compared with the Metf group; # p < 0.05, compared with the model group; *p < 0.05, compared with the control group. Six mice in each group were randomly selected for analyses.

