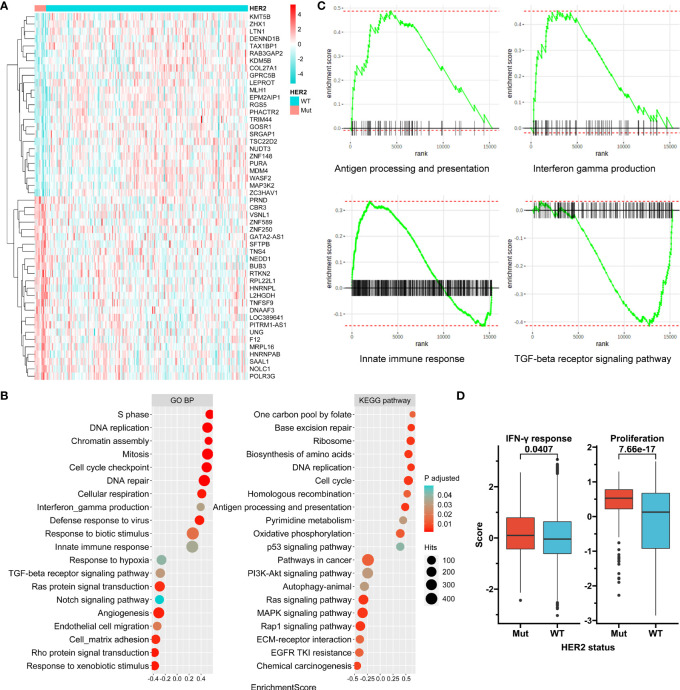
Figure 4.
Transcriptome features associated with HER2 mutation. (A) A clustered heat map for top 40 genes differentially expressed between HER2 mutation (Mut) and wild-type (WT) subgroups in ACRG. (B) Selected enriched signaling pathways based on Kyoto Encyclopedia of Genes and Genomes (KEGG) and biological process (BP) terms of Gene Ontology (GO) in gene set enrichment analysis (GSEA). (C) Enrichment plots for selected immune-associated signaling or functions. (D) Tumor proliferation and interferon-gamma response scores according to HER2 mutation status in the TCGA Pan-Cancer cohort. ACRG, Asian Cancer Research Group; TCGA, The Cancer Genome Atlas.

