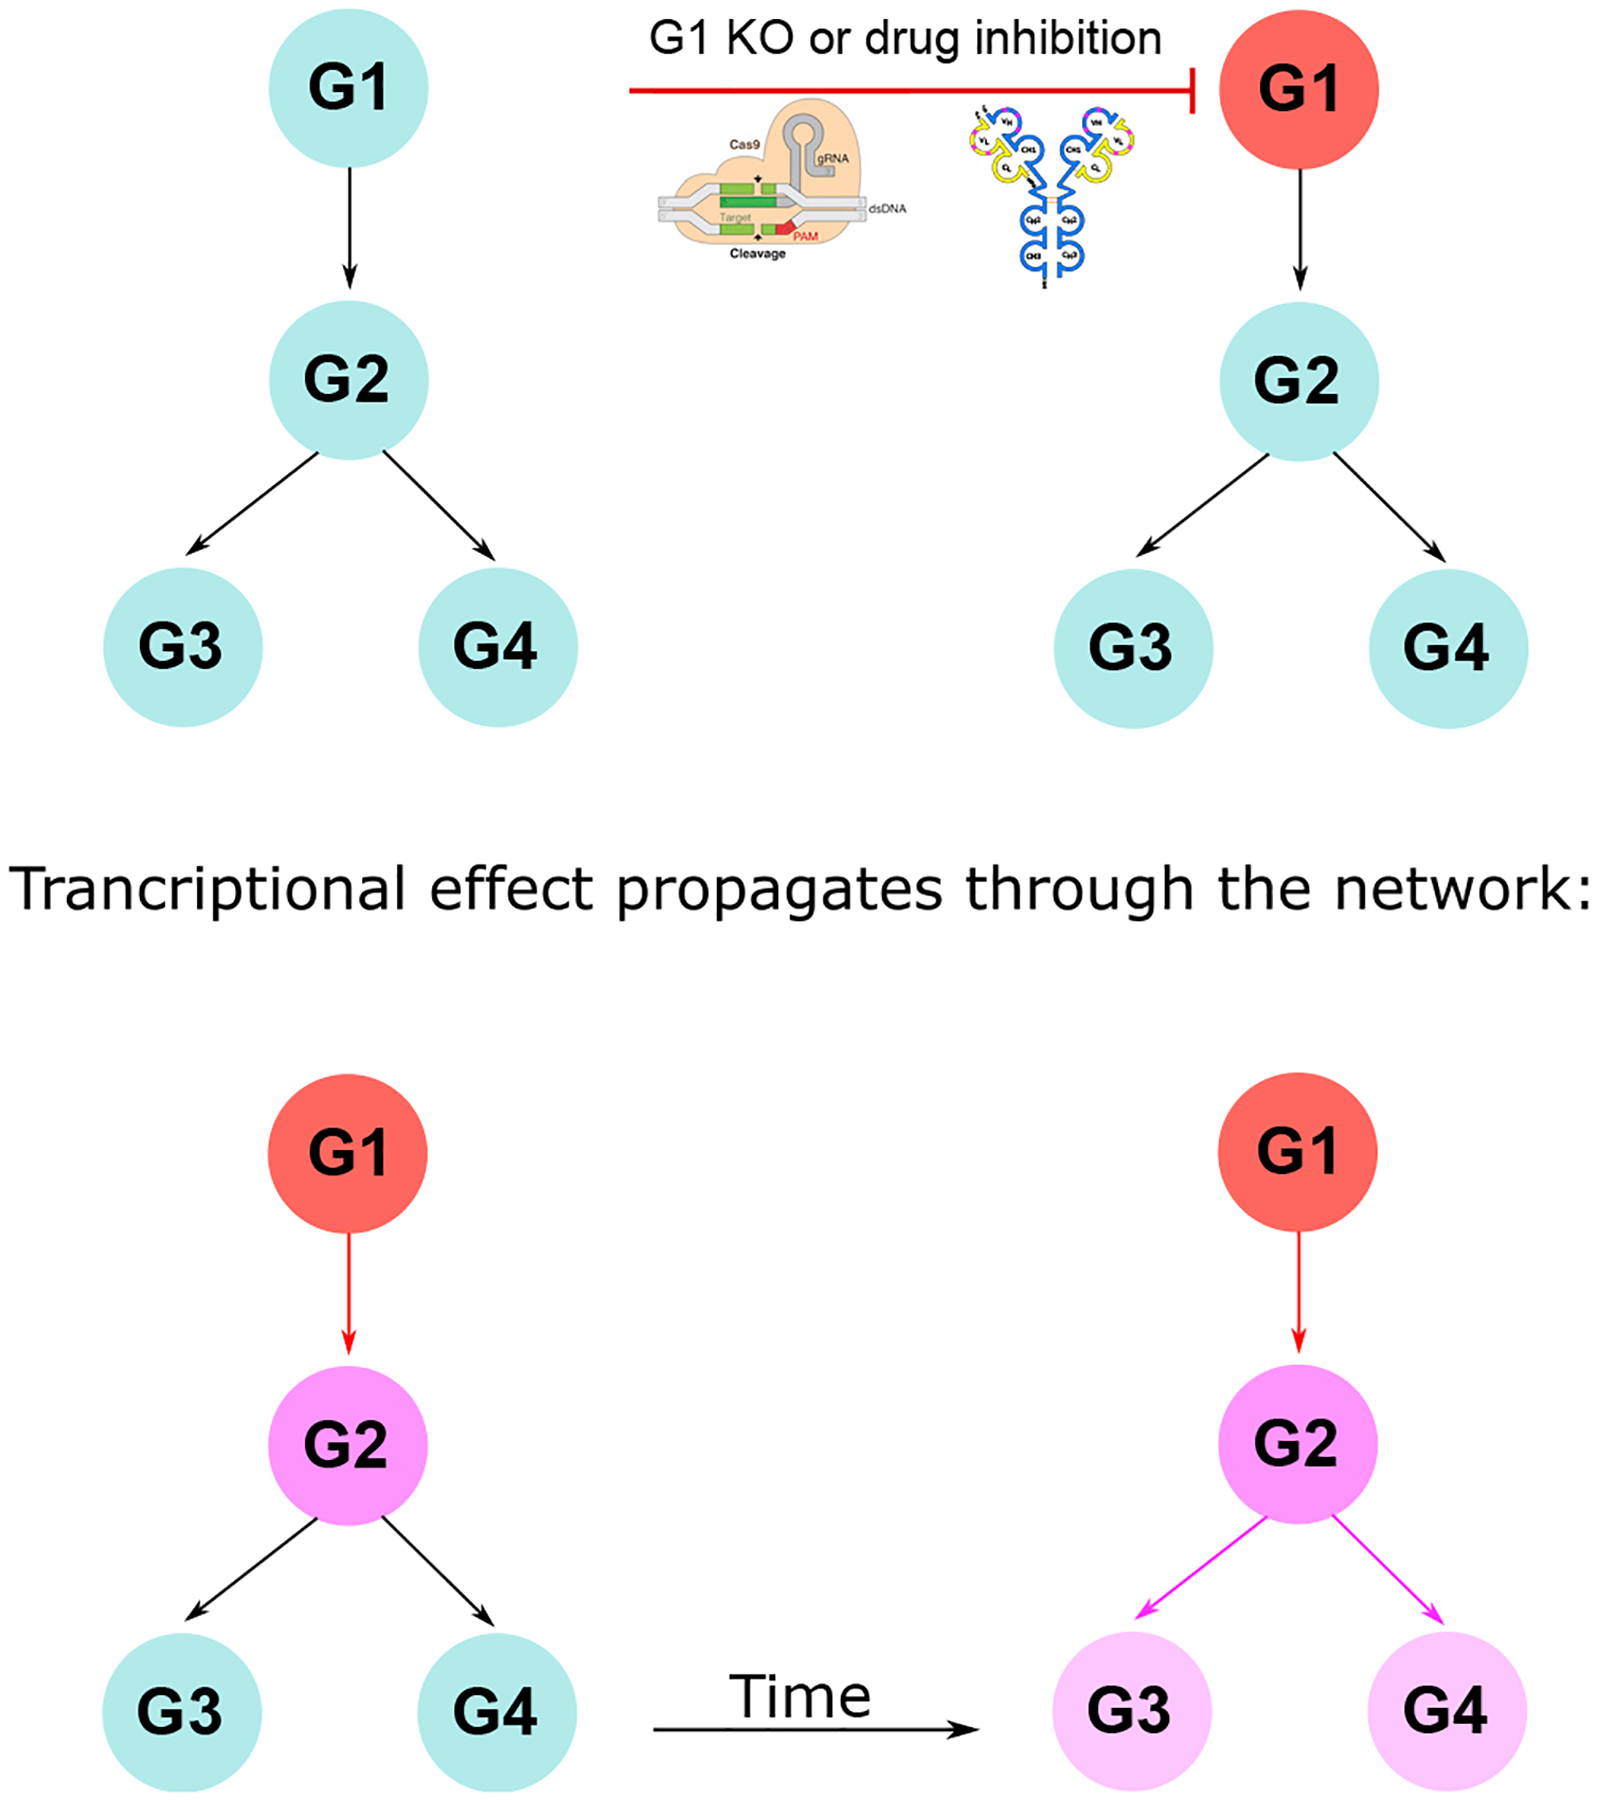
Figure 5. A network model of a transcriptomic perturbation.

Illustration of how a genetic perturbation can be modeled using a graphical network. After a KO or inhibition by a drug, the network describes which genes will be transcriptionally affected by this perturbation and in which order. By quantifying these relationships, the transcriptional impact can be predicted along with the mechanistic steps that would produce it. This diagram can be generalized to interactions between proteins and other molecular effectors, including components like GRNA-Cas9 by Marius Walter, licensed under Creative Commons CC BY-SA 4.0, and Antibody_structureA by Michael Jeltsch, licensed under Creative Commons CC BY-NC-SA 4.0.
