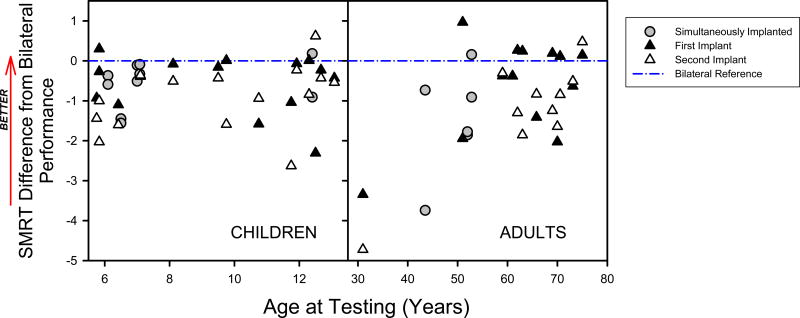
Figure 4.
Performance on the SMRT task with a single cochlear implant relative to bilateral performance are plotted as a function of age for children (left panel) and adults (right panel). Each plotted point represents the deviation between the bilateral SMRT and one of the unilateral SMRT conditions. Baseline performance (i.e. the bilateral SMRT score for a given user) is set to 0 and is represented by the dashed blue line. Positive values indicate a unilateral SMRT condition that provides a higher score than the bilateral baseline. Negative values indicate a unilateral SMRT condition that provides a lower score than the bilateral baseline. For sequentially implanted users, the first implant is represented by a solid triangle and the second implant is represented by a hollow triangle. For simultaneously implanted users, scores with each implant alone are represented by a grey circle. Note that for one subject (CA06), no SMRT score was measurable for the second implant and therefore no second data implant data point is presented for this subject.

