Figure 2.
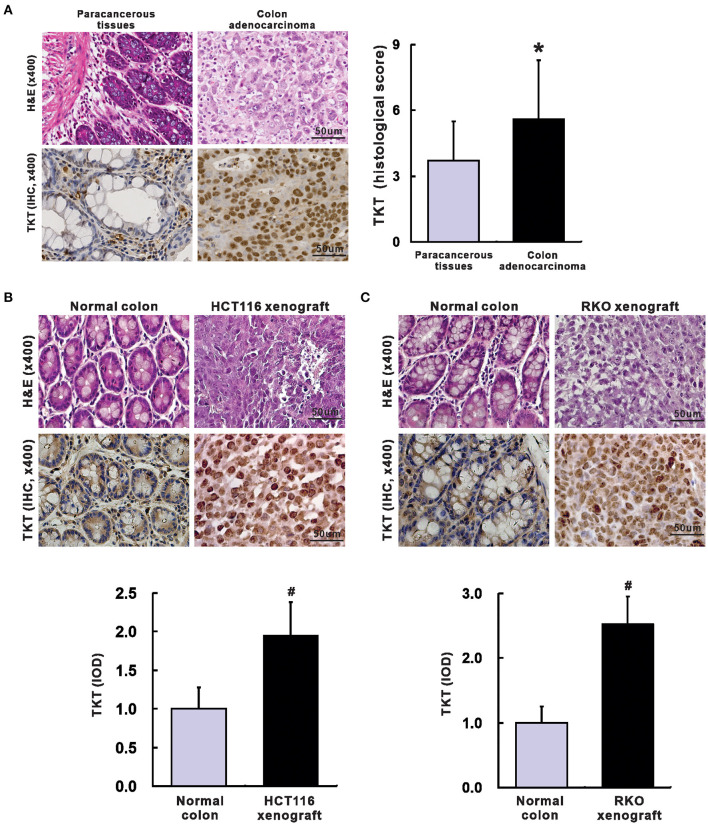
Up-regulation of TKT in colon adenocarcinoma. (A) Representative images for H&E (left up) and IHC of TKT (left lower) were shown, and the histological score of TKT for colon adenocarcinoma tissues (right) was significantly higher than that for the corresponding paracancerous tissues, N = 60 in the paracancerous tissues group, N = 100 in the colon adenocarcinoma tissues group; (B) Representative images for H&E (upper panel of images) and IHC of TKT (lower panel of images) were shown, and the histological score of TKT for HCT 116 xenografts, whose expression was significantly higher than that for the corresponding normal colon tissues; (C) Representative images for H&E (upper panel of images) and IHC of TKT (lower panel of images) were shown, and the histological score of TKT for RKO xenografts, whose expression was significantly higher than that for the corresponding normal colon tissues, N = 6/group. *P <0.05 vs. paracancerous tissues; #P <0.05 vs. normal colon tissues in mice.

