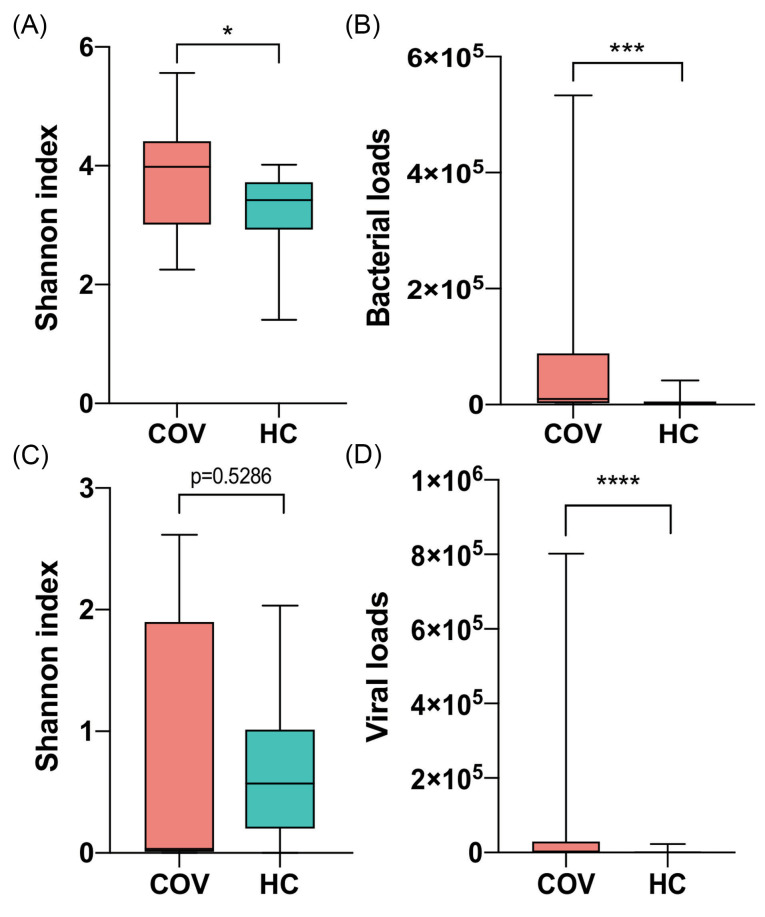
Figure 1.
Comparison of microbial α-diversity and loads between COVID-19 patients (COV) and healthy controls (HC). (A) and (C) Shannon index of bacteria and virus respectively. (B) and (D) Bacterial and viral loads respectively. Boxes represent the interquartile ranges (IQRs) between the first and third quartiles, and the line inside the box represents the median; whiskers represent the lowest or highest values within 1.5 times IQR from the first or third quartiles. * P value < 0.05, ** P value < 0.01, *** P value <0.001, **** P value <0.0001.

