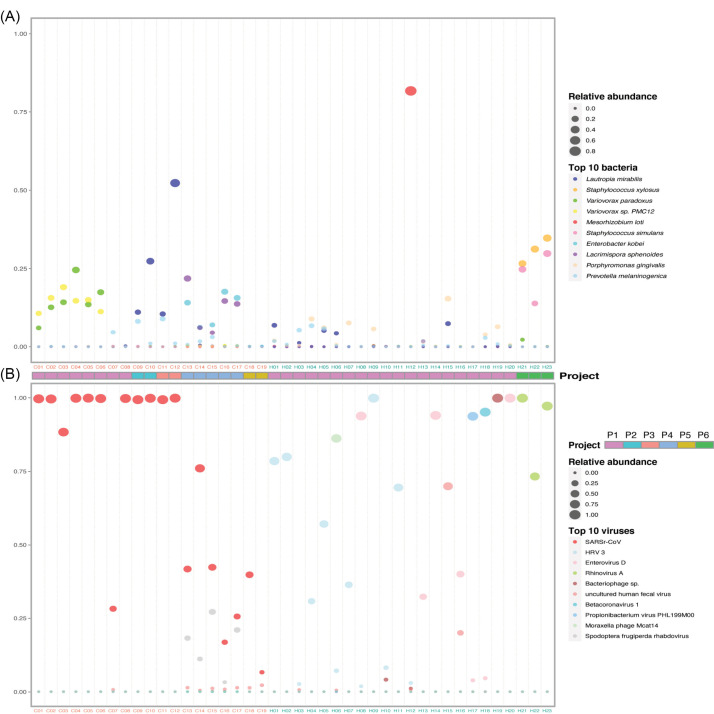
Figure 3.
Composition of the top 10 species in COVID-19 patients and healthy controls. (A) and (B) Relative abundance of the top 10 bacteria and viruses respectively in each sample. The size of the point corresponds to the relative abundance value. The color of the sample names represents the sample group, red represents the COVID-19 patient group, and blue represents the healthy control group. The order of the species in the legend from top to bottom represents the relative abundance from high to low. Project bar represents the sample sources (P1, PRJCA002202; P2, PRJNA601736; P3, PRJCA002326; P4, PRJNA605983; P5, PRJNA615032; P6, PRJNA434133).

