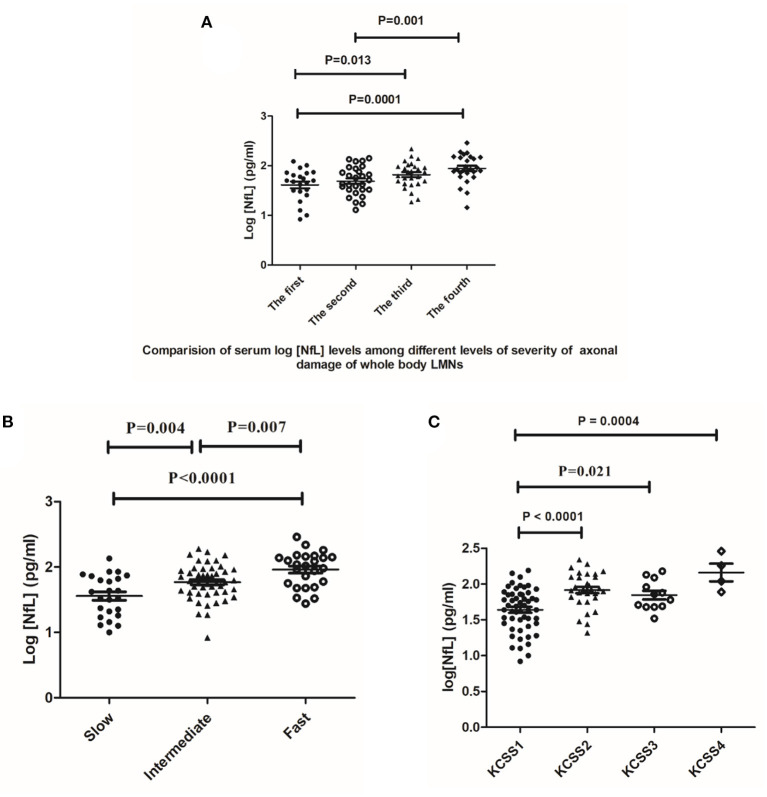
Figure 3.
(A) Comparison of serum log[NfL] levels among four relative score quartiles of ALS. The mean value and scatter and dispersion of the observations are shown. Error bars indicate SD. P values were calculated using one-way ANOVA (N = 103). (B) Comparison of serum log[NfL] levels among the slow progression group, intermediate progression group, and fast progression group (N = 96). (C). The serum levels of log[NfL] were positively correlated with the number of regions assessed by KCSS stages (N = 99). One-way ANOVA with post-hoc analysis by Tukey's multiple comparison test.

