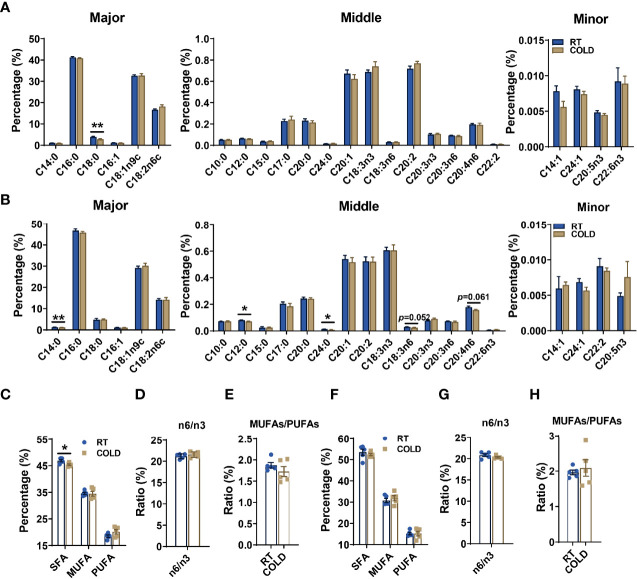
Figure 2.
Cold exposure changed the composition and proportions of fatty acids. Fatty acid composition analyses of SAT and VAT isolated from pigs maintained at RT or in COLD for 14 hours. (A) The relative concentration of individual fatty acids in SAT from RT and COLD pigs. Fatty acids are divided into major, middle and minor species based on abundance. Fatty acids are sorted by a degree of saturation. (B) The relative concentration of individual fatty acids in VAT from RT and COLD pigs. (C) The percentages of total SFAs, MUFAs and PUFAs in SAT from RT and COLD pigs. SFAs, saturated fatty acids; MUFAs, monounsaturated fatty acids; PUFAs, polyunsaturated fatty acids containing two or three to six double bonds. (D) The ratio of n6-fatty acids: n3-fatty acids (n6: n3) and (E) MUFAs: PUFAs in SAT from RT and COLD pigs. (F) The percentages of total SFAs, MUFAs and PUFAs in VAT from RT and COLD pigs. (G) The ratio of n6-fatty acids: n3-fatty acids (n6: n3) and (H) MUFAs: PUFAs in VAT from RT and COLD pigs. n = 5. Error bars represent S.E.M. *P < 0.05, **P < 0.01, two-tailed Student’s t-test.

