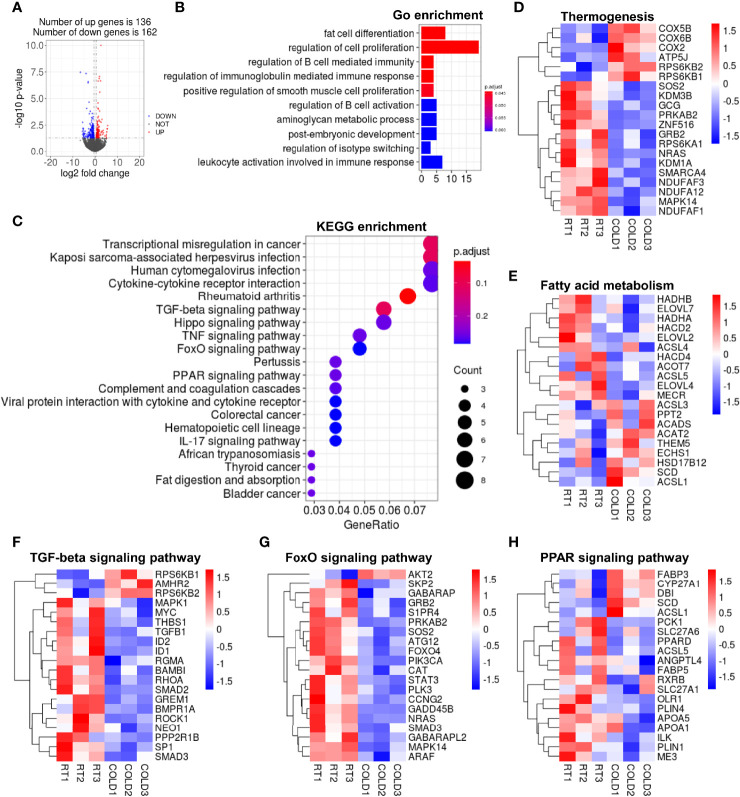
Figure 4.
Cold exposure changed the transcriptome profile of VAT in pigs. (A) Volcano plot of differently expressed genes (DEGs) expression patterns were illustrated. Red denotes upregulated genes in COLD VAT; blue denotes downregulated genes in COLD VAT; gray denotes genes with no significant changes. (B) Gene Ontology (GO) enrichment analysis. (C) Functional enrichment analyses using Kyoto Encyclopedia of Genes and Genomes (KEGG) pathways. (D, E) Heatmaps of the TPM expression values of selected thermogenesis, fatty acid metabolism regulated genes from the RNA-seq dataset. (F–H) KEGG results of the cold-induced enrichment of genes involved in TGF-beta signaling pathway (F), FoxO signaling pathway (G), PPAR signaling pathway (H).

