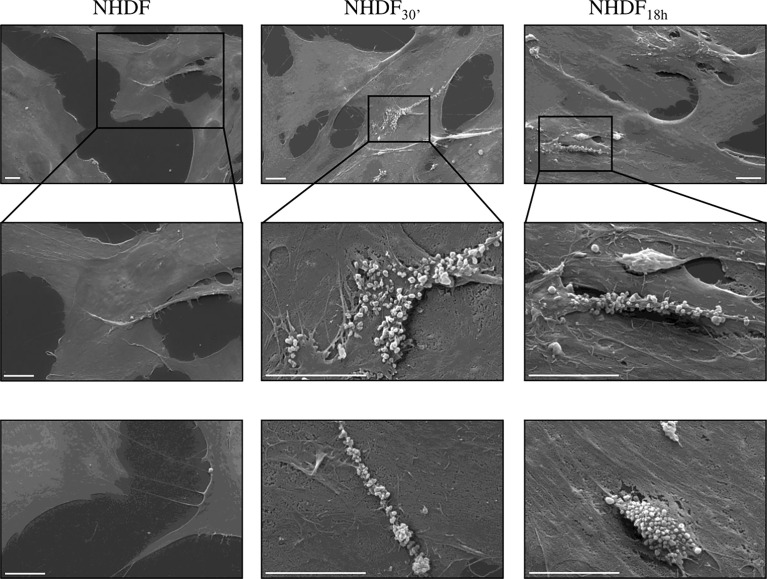
Figure 6.
Scanning electron microscopy (SEM). SEM images highlighted the intense shedding of microvesicles from the plasma membrane of NHDF30′ and NHDF18h. On the other hand, NHDF cells showed an extremely sporadic production of microvesicles. The first row shows images at low magnification; the second row shows details of the first row at higher magnification, as highlighted by the boxes; row 3 shows other independent and representative images at higher magnification. The scale bar is 10 µm in all images.

