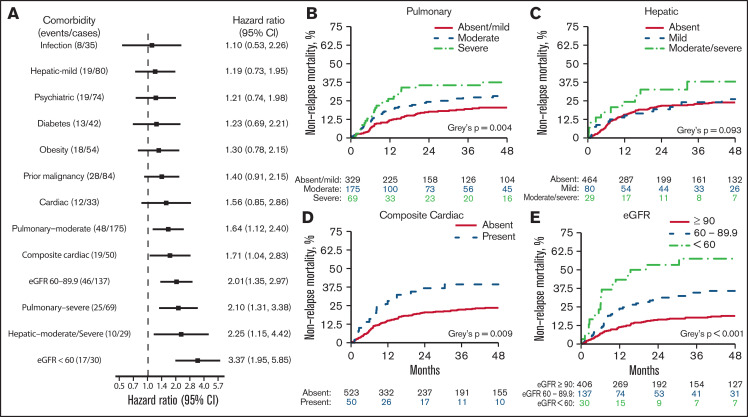
Figure 2.
NRM associated with individual comorbidities. (A) Forest plot of HR for NRM associated with the presence of individual comorbidities; HRs are extracted from a multivariable model. (B-E) Cumulative incidence of NRM. P values were from a multivariable cause-specific Cox model. eGFR was measured using the CKD-EPI formula.

