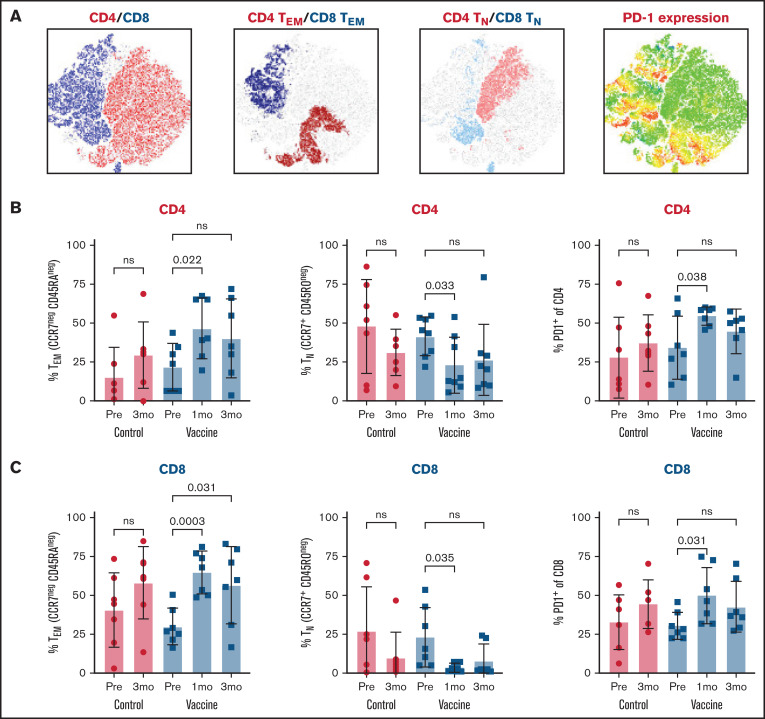
Figure 2.
Bone marrow immunophenotyping after ASCT and mRNA-electroporated LC vaccines. BMMCs were analyzed by flow cytometry to profile the lymphocyte composition postvaccination in comparison with baseline (prevaccine) and an unvaccinated control cohort. (A) t-Distributed stochastic neighbor embedding plots at 3 months after vaccination showing CD4 and CD8 T cells (far left plot), CD4 and CD8 effector memory cells (TEM; CCR7negCD45RAneg) (middle left plot), CD4 and CD8 naive cells (TN; CCR7+CD45ROneg) (middle right plot), and PD-1–expressing CD4 and CD8 cells (far right plot). CD4 (B) and CD8 (C) effector memory, naive, and PD-1–expressing cells at 1 and 3 months after vaccines. Pooled data (mean ± standard deviation) are shown for patients in the control (red circles) and vaccine (blue squares) arms. ns, not significant; Pre, prevaccine.

