Figure 4.
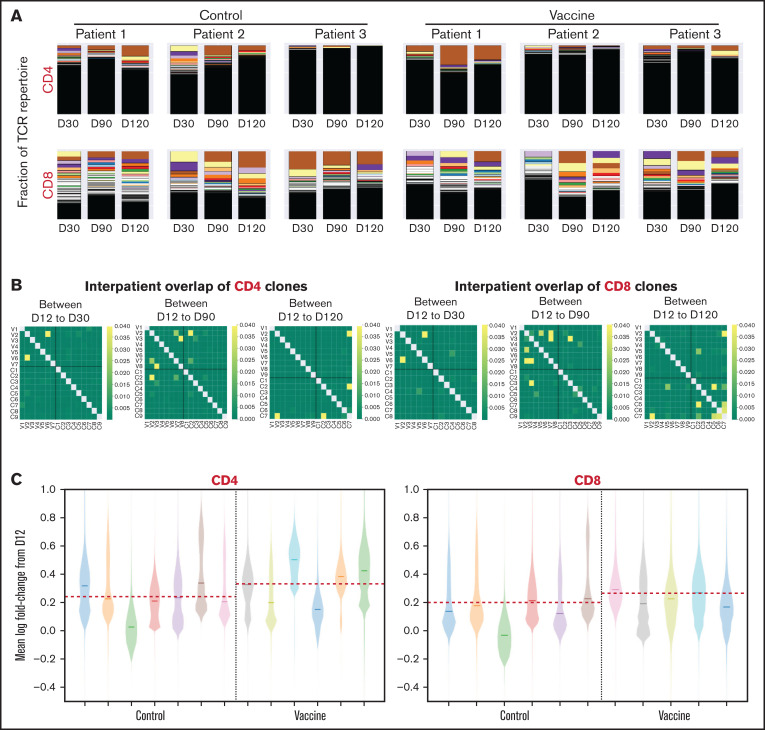
T-cell clonality after ASCT and vaccination with mRNA-electroporated LCs. Next-generation deep sequencing of the TCR-V-β CDR3 was performed on CD4 and CD8 T cells isolated from PBMCs obtained at days 30, 90, and 120 after ASCT and compared with prevaccine levels (day 12). (A) Stacked bar plots of CD4 and CD8 T-cell repertoire composition from 6 representative patients (3 from vaccine arm, 3 from control arm). Each color represents a unique clone, with the higher-percentage clones at the top and lower-percentage clones underneath (low-frequency clones blend together in black). (B) Heat maps of interpatient overlap of CD4 and CD8 T-cell clones calculated using the Morisita similarity index (dark yellow = similar; dark green = dissimilar). V1-V9 along the x- and y-axes represent vaccinated patients. C1-C9 along the x- and y-axes represent control patients. (C) Violin plots representing the mean log fold change in CD4 and CD8 T-cell expansion. Each color represents an individual patient. The red dashed line represents the mean log fold change value in each group. D12, day 12; D30, day 30; D90, day +90; D120, day 120.

