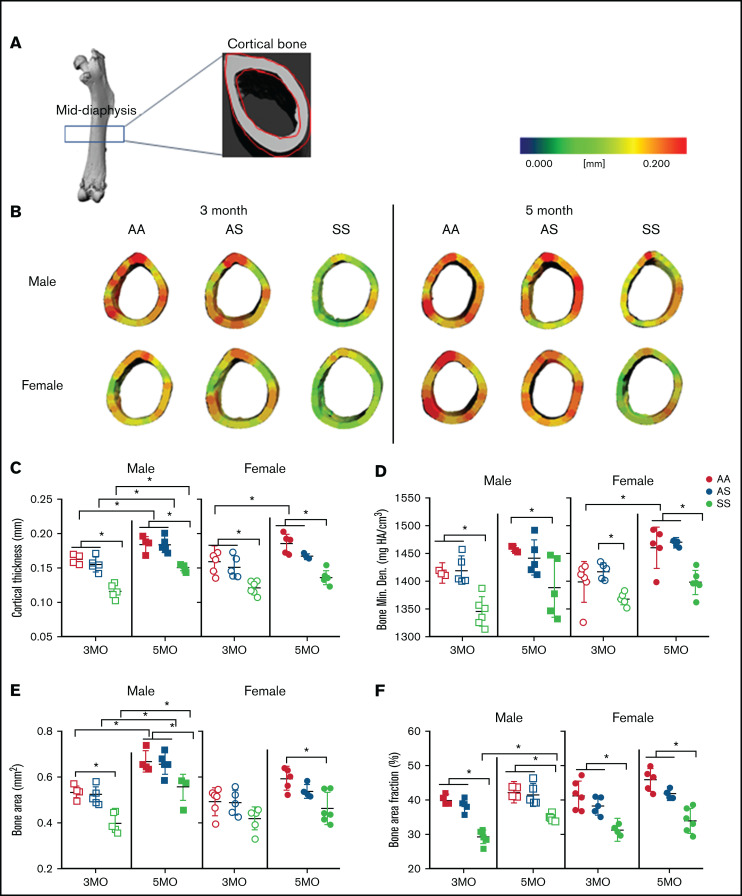
Figure 3.
SCD mediates reduced cortical bone thickness in male and female mice. (A) Representative microCT image of an entire femoral bone, including a microCT scan of the mid-diaphysis outlined in red. (B) Representative three-dimensional heat maps of cortical thickness in the mid-diaphyseal region in AA, AS, and SS of 3-month-old (left) and 5-month-old (right) male and female mice. A pseudocolor scale of blue (0 mm) to red (0.2 mm) depicts cortical thickness. Cortical bone parameters generated by microCT scans for male and female mice include: cortical thickness (C); BMD (D); BA (E); and BA/TA (F). AA = black, AS = gray, SS = red. Data are expressed as mean ± standard deviation. Statistical significance, *P < .05, determined by two-way analysis of variance with Tukey’s post hoc test; n = 4 to 6 mice per group; scale bar, 100 μm. Bone Min. Den., BMD; HA, hydroxyapatite.

