
Fig. 4.
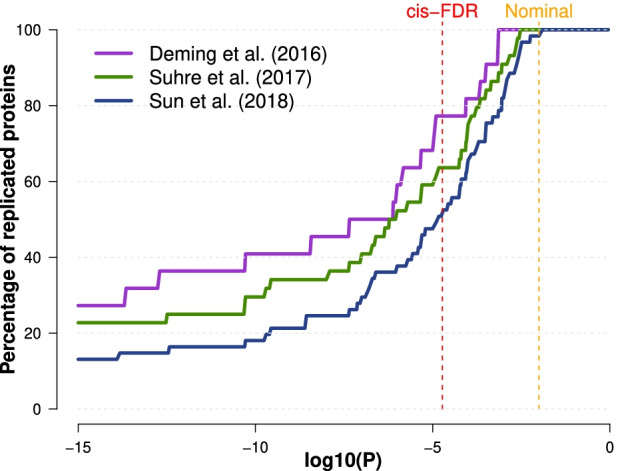
Replication of cis-pQTLs. The percentage of replication of previously reported cis-regulated proteins between our analysis and three previous studies: Sun et al. [22], Suhre et al. [23], and Deming et al. [24]. For each dataset, the percentage of replication (y-axis) as a function of the significance threshold (x-axis) was computed as the number of cis-regulated proteins reported in this work that were also reported in the corresponding dataset as cis-regulated (the “replicated” proteins) divided by the total number of proteins reported as cis-regulated in a previous study that were analyzed in our work (the “replicable” proteins). The dashed vertical lines represent the p-value significance threshold corresponding to the FDR of cis-pQTLs (red) and to the nominal replication threshold (orange)