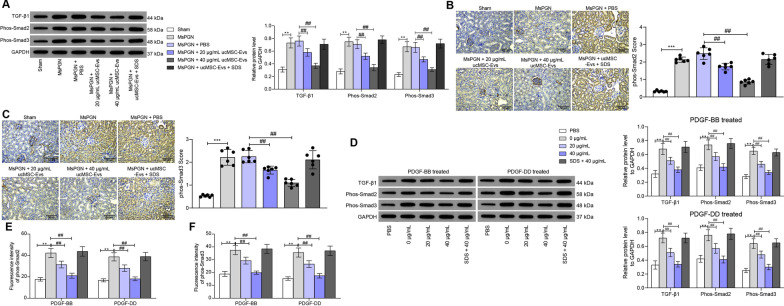
Fig. 3.
ucMSC-Evs suppress activation of the TGF-β1/Smad2/3 signaling pathway in anti-Thy-induced rats and PDGF-treated cells. A expression of TGF-β1 and phosphorylation of Smad2/3 in rat renal tissues examined by western blot analysis; B, C phos-Smad2/3-positive scores in rat renal tissues detected by IHC staining; D expression of TGF-β1 and phosphorylation of Smad2/3 in rMCs examined by western blot analysis; E, F subcellular localization of Smad2/3 in rMCs determined by immunofluorescence staining. In animal models, n = 6 in each group. Each spot indicates a single rat. Data were expressed as mean ± SD from at least three independent experiments. Data were analyzed by one- two-way ANOVA, followed by Tukey’s multiple comparison test. **p < 0.01 versus sham group or PBS group; ##p < 0.01 versus MsPGN + PBS or 0 μg/mL group

