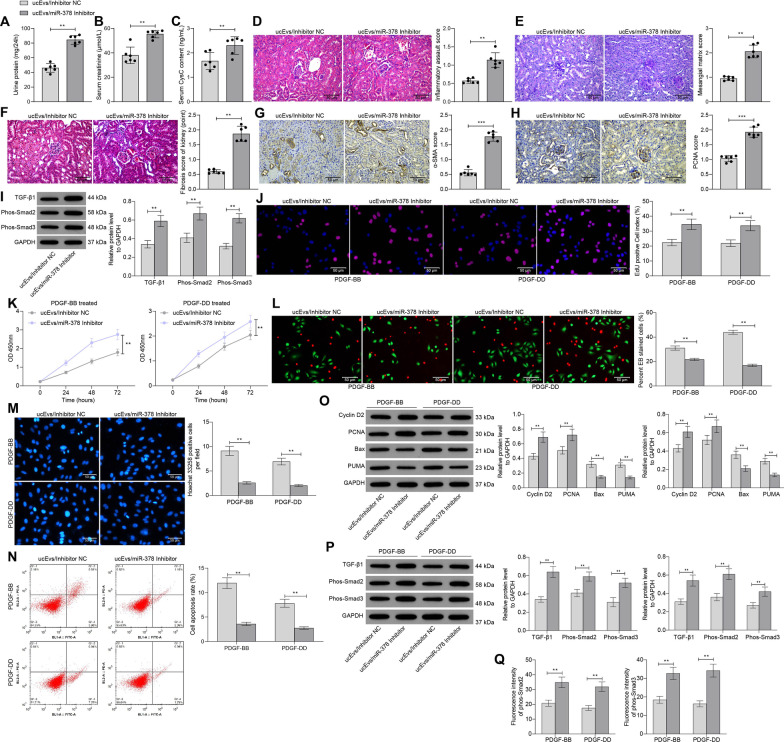
Fig. 5.
Reduction of miR-378 blocks the functions of ucMSC-Evs. A 24-h urine protein level in rats; B, C, serum creatinine (B) and Cys-C (C) levels in rats; D pathological changes in mouse renal tissues observed by HE staining; E, the concentration of glycogen in the renal tissues in MsPGN rats determined by PAS staining; F, fibrosis in rat renal tissues determined by Masson's trichrome staining; G, H staining intensity of α-SMA (G) and PCNA (H) and in renal tissues determined by IHC staining, I, expression of TGF-β1 and phosphorylation of Smad2/3 in rat renal tissues determined by western blot analysis; J proliferation of rMCs determined by EdU labeling; K viability of cells determined using a CTG kit; L portion of dead cells confirmed by EB fluorescence staining; M apoptosis of cells determined by Hoechst 33,258 staining; N, apoptosis rate of cells determined by flow cytometry; O protein expression of Cyclin D2, PCNA, Bax and PUMA in cells determined by western blot analysis; P expression of TGF-β1 and phosphorylation of Smad2/3 in rMCs determined by western blot analysis; Q expression of phos-Smad2/3 in cells determined by immunofluorescence staining. In animal models, n = 6 in each group. Each spot indicates a single rat. Data were expressed as mean ± SD from at least three independent experiments. Data were analyzed by the unpaired t test or two-way ANOVA followed by Tukey’s multiple comparison test. **p < 0.01, ***p < 0.001 versus Evs/Inhibitor control group

