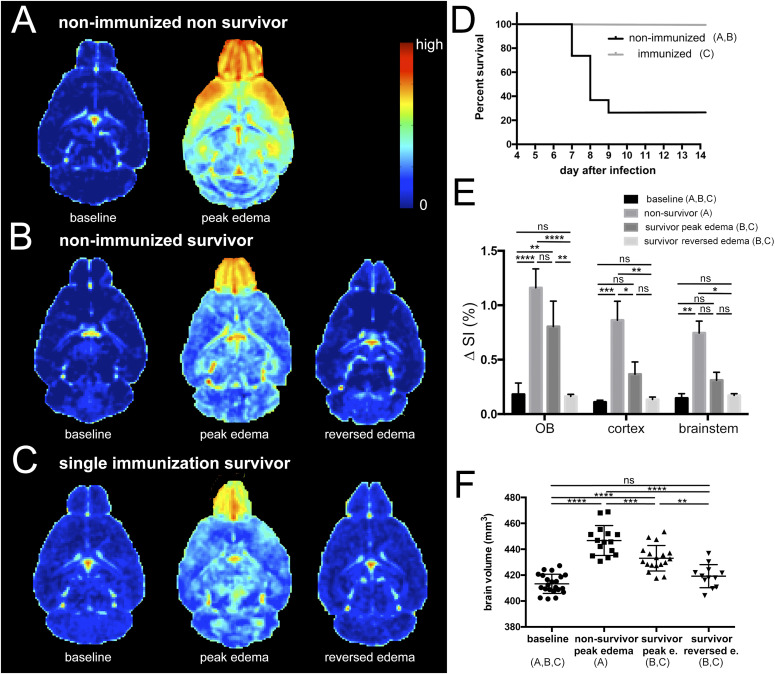
Figure 1. Reversible brain swelling in experimental cerebral malaria.
(A, B, C) Subtraction images of T1-weighted images are displayed to illustrate the degree and spatial distribution of blood–brain barrier disruption (BBBD) in surviving and non-surviving mice. (D) Survival curves of wild-type infected mice and mice after single vaccination (A n = 15, B n = 5; C n = 13). (E) The difference in signal intensity (ΔSI) as a measure of BBBD is present in the olfactory bulb, cortex and brainstem in all groups. Most pronounced signal alterations are seen in the olfactory bulb. In cortex and brainstem less BBBD is seen in survivors. After edema resolves BBB, normalizes and returns to baseline values. (F) The degree of brain swelling is shown at baseline, in non-survivors and survivors at the acute stage and after edema has reversed in surviving mice. Peak edema occurred at day 8.1 ± 0.6 d post infection in non-immunized non-survivors, at day 8.8 ± 0.4 d post infection in non-immunized survivors and at 9.4 ± 0.8 d post infection. Edema lasted 1–3 d. Day 11 after infection was the last day edema was observed. Day 14 after infection was the imaging time point for reversed edema in all mice. Significance levels were tested with one-way ANOVA.

