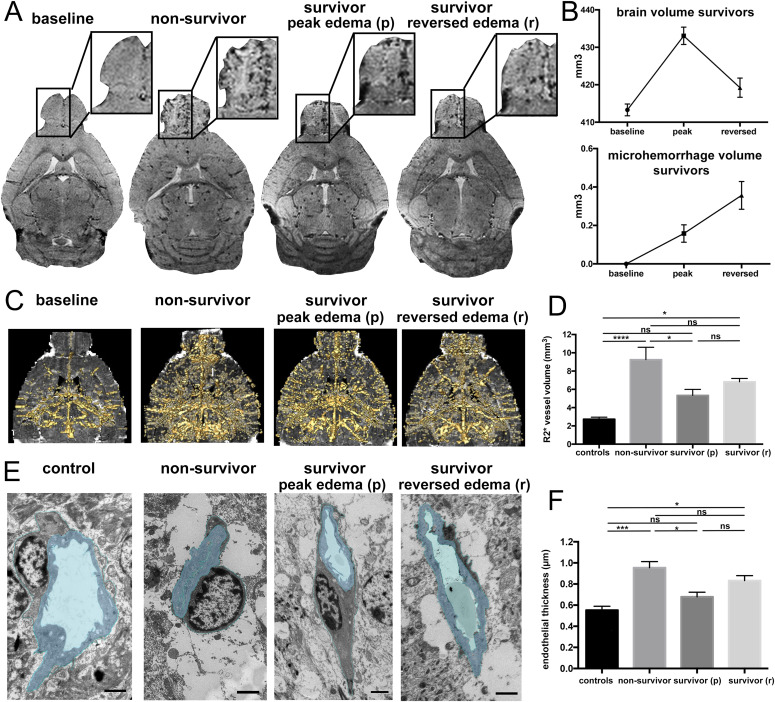
Figure 3. Reperfusion injury on the microscopic and ultrastructural level.
(A) Exemplary T2*w images are displayed. At baseline, no microhemorrhages are apparent (arrows). In severe disease a high microhemorrhage load is seen, mainly in the olfactory bulb (OB). In survivors microhemorrhages increase after edema has resolved. (B) Graphs illustrate the increase of microhemorrhage volume, whereas brain volume reverses. (C) Segmented vessels (gold) on R2* datasets are displayed. The segmentation delineates vessel lumen and vessel wall. In non-survivors vessel volume is highest. (D) R2* vessel volume throughout the groups is presented. (n = 5–13). (E) Ultrastructural endothelial changes on TEM images are illustrated by one example of a vessel from each group. In healthy mice, the endothelium is thin with an open lumen. Astrocyte end feet cover the endothelium. In non-survivors, the endothelium is thicker, the lumen collapsed, and surrounded by swollen astrocyte end feet. Survivors in the acute stage of disease show a slight increase in endothelial thickness, but also swollen astrocyte end feet. Astrocyte end feet swelling decreases after edema has reversed, but endothelial thickness slightly increases. (F) Average endothelial thickness in all groups is displayed (n = 3–5); Significance levels were tested with one-way ANOVA.

