. 2022 Feb 21;13(10):2992–3001. doi: 10.1039/d1sc05930k

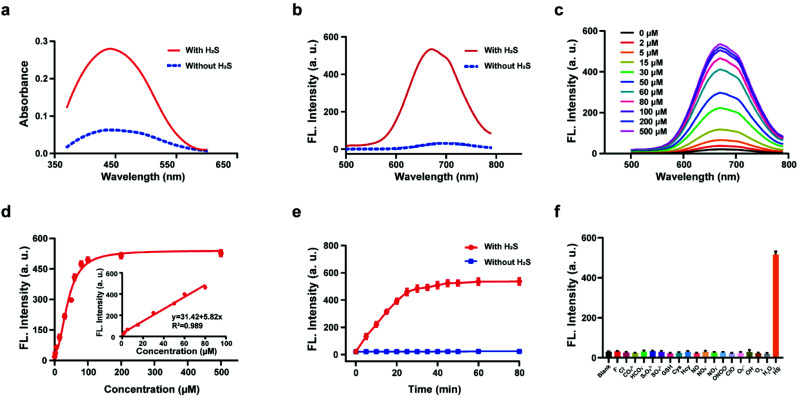
Fig. 1. Absorption spectra (a) and fluorescence spectra (b) of probe HL-H2S with H2S (from NaHS) concentration (100 μM) with H2S (solid line) and without H2S (dotted line). (c) Fluorescence spectra of HL-H2S with the increasing H2S concentration (0–500 μM). (d) Calibration curve for the determination of H2S (inset linear response at lower H2S concentrations). (e) Time dependent fluorescence intensity of HL-H2S in the absence and presence of H2S (100 μM). (f) Response of HL-H2S to 200 μM different interferents (HL-H2S alone (blank)); F, Cl, CO32−, HCO3, S2O32−, SO42−, GSH, Cys, Hcy, NO, NO3, NO2, ONOO, ClO, O2˙, ˙OH, 1O2, H2O2, HS, respectively. For all experiments the concentration of HL-H2S was 10 μM. λex = 450 nm, in PBS (pH = 7.4, containing 2% DMSO and 80% glycerol). In (d–f), data represent the mean of three replicates and the error bars indicate the SD.

Fig. 1