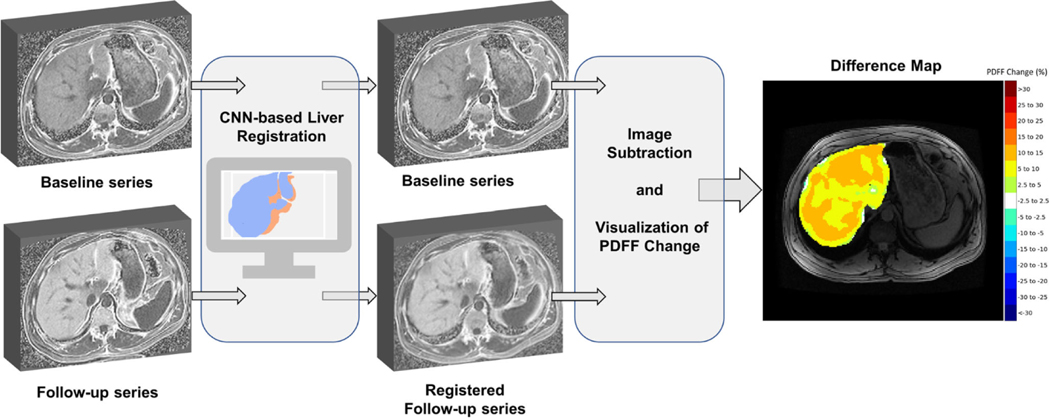
Fig. 1.
Development of difference color maps for longitudinal visualization and assessment of PDFF change. Follow-up PDFF maps are registered to baseline PDFF maps using a CNN-based liver registration algorithm. Registered follow-up PDFF maps are then subtracted from baseline PDFF maps, smoothed using a 5 cm2 round kernel, and colorcoded using a categorical color scale to create PDFF difference maps

