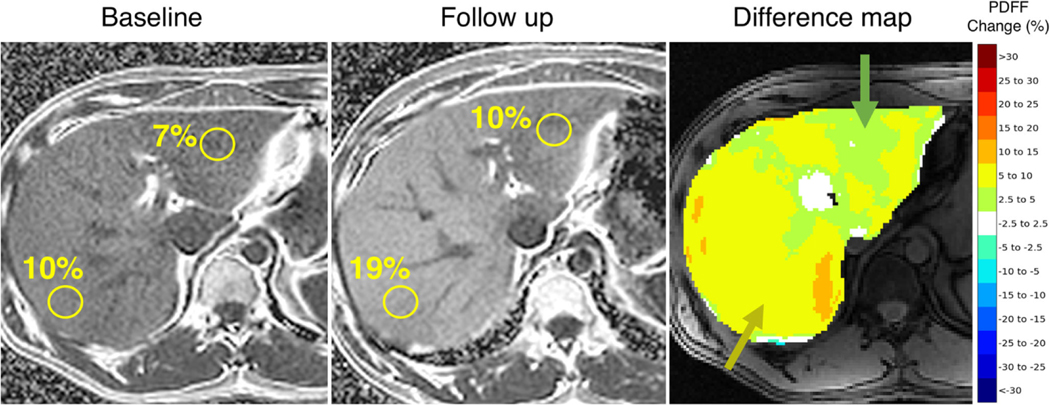
Fig. 2.
The same patient baseline and follow-up PDFF maps with manually drawn ROIS and corresponding difference map for visual assessment of longitudinal PDFF change. According to manual ROIs, the patient exhibits a 3% increase and 9% increase in segments Ill and VIl, respectively. These heterogeneous increases are visually captured by the proposed difference map with the predominant alterations in green (2.5 – 5%) and yellow (5 – 10%), respectively

