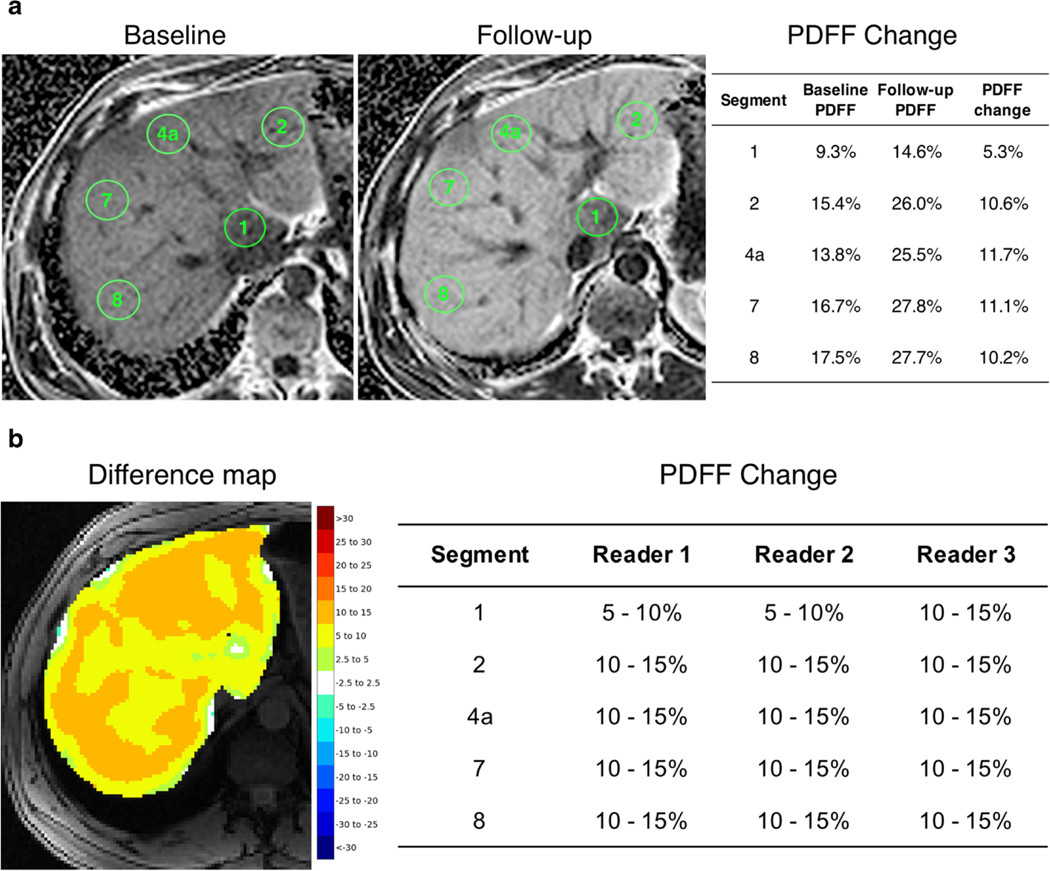
Fig. 3.
Example ROI annotations on baseline and follow-up PDFF maps to manually estimate longitudinal PDFF change compared to readers visual assessment (a, b). 5 cm round ROIS were manually drawn in each of the 9 liver Couinaud segments across baseline and follow-up PDFF maps. Longitudinal PDFF changes were computed by subtracting followup segmental mean PDFF estimates from their corresponding baseline PDFF estimates (a). Readers’ visual assessment of segmental PDFF changes using the difference map (b)

