. 2022 Mar 8;10(3):e003982. doi: 10.1136/jitc-2021-003982

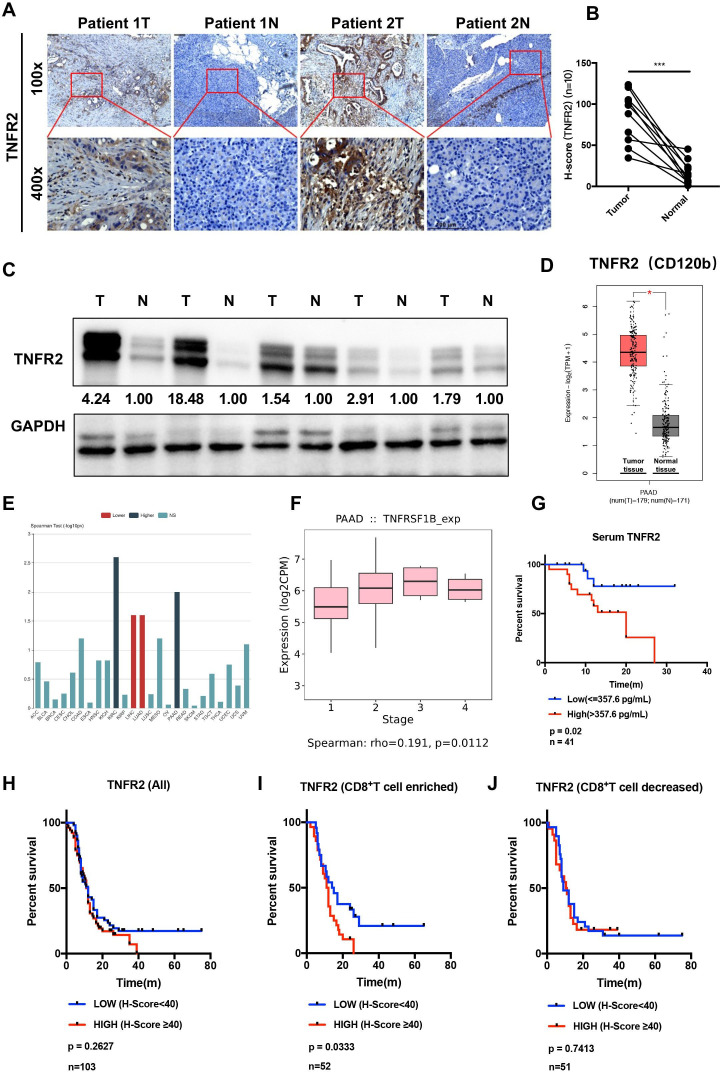
Figure 1. The expression and prognostic analysis of TNFR2 in pancreatic ductal adenocarcinoma (PDAC). (A–C) The expression profile of TNFR2 in pancreatic cancer was detected in paired tumor and normal pancreatic tissues by IHC staining (n=10) (A and B) and western blotting analysis (n=5) (C) (N, normal pancreatic tissue; T, pancreatic tumor tissue). Scale bars: 100 µm. (D) The relative TNFR2 expression in pancreatic cancer and normal pancreatic tissues was analyzed using large-scale RNA-seq datasets of PDAC from the TCGA database (n=350). (E–F) Association between the expression of TNFR2 and tumor stage using large-scale RNA-Seq datasets of PDAC from the TCGA database. (G) Overall survival (OS) of patients with pancreatic cancer with high or low concentrations of TNFR2 in their serum (n=41). (H–J) Overall survival (OS) of patients with all pancreatic cancer (H), enriched with CD8+ T cells (I) and decreased with CD8+ T cells (J), with high or low expression of TNFR2. IHC, immunohistochemistry; TCGA, The Cancer Genome Atlas; TNFR2, tumor necrosis factor receptor 2.

Figure 1