
Fig. 1.
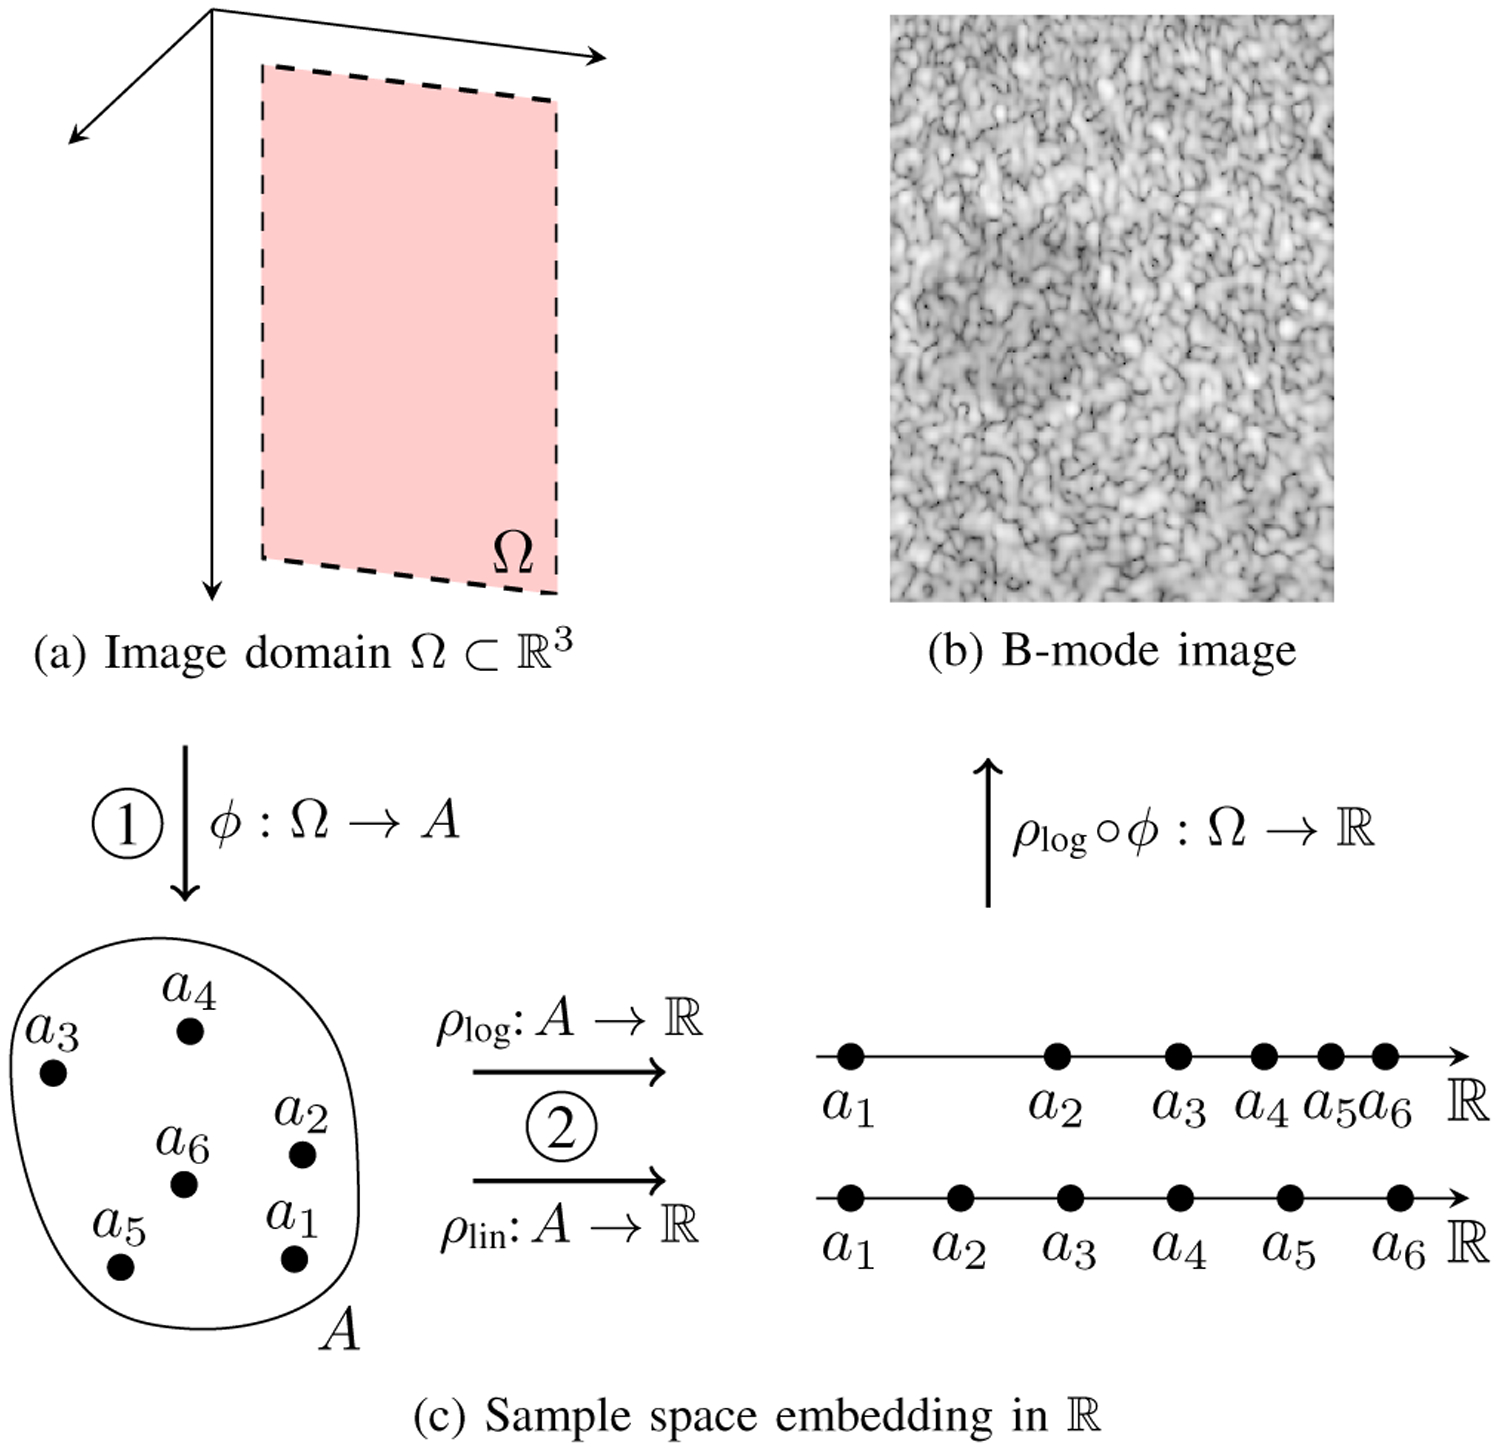
(a) A 2D FOV Ω in 3D space. (b) A log-compressed B-mode image with a −6 dB lesion. (c) Image formation is decomposed into two distinct steps: 1) mapping Ω to an abstract sample space A using ϕ, and 2) embedding A in using ρ. Examples of a linear and logarithmic embedding are shown. The final image in (b) corresponds to the composition of ϕ with ρlog.