. 2022 Mar 9;130(3):037001. doi: 10.1289/EHP9835

Figure 2.

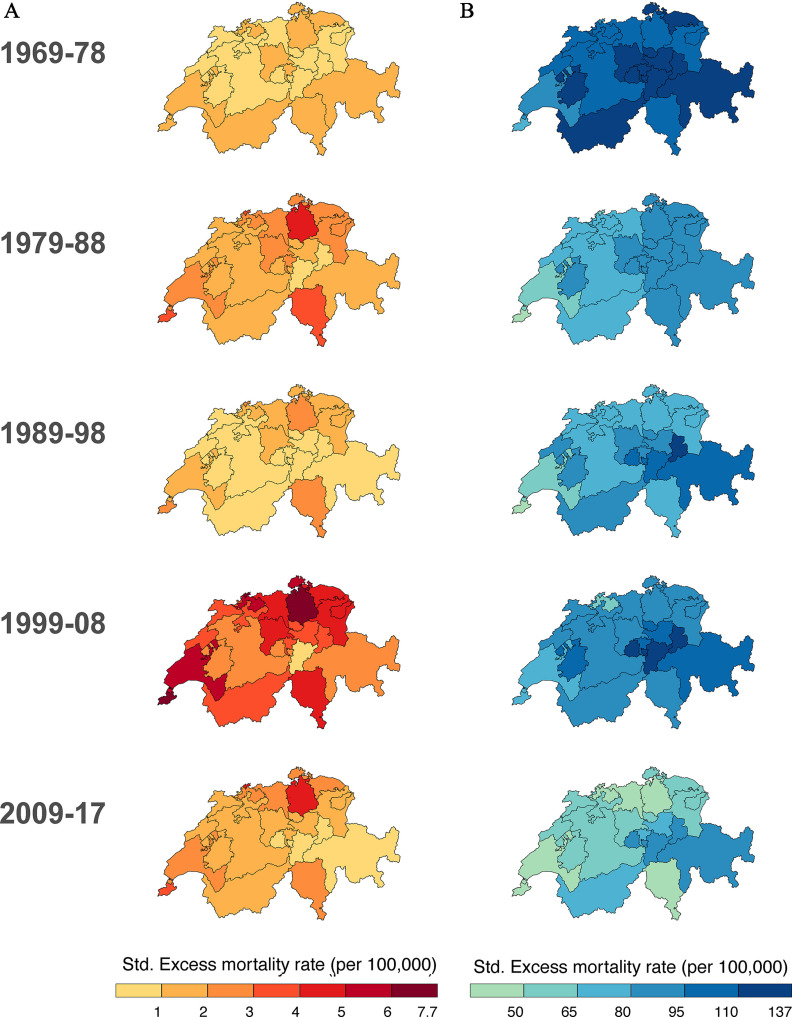
Figure 2a is a set of five maps of Switzerland depicting age-standardized excess mortality rate due to heat in years, including 1969 to 1978, 1979 to 1988, 1989 to 1998, 1999 to 2008, and 2009 to 2017. A scale depicting standardized excess mortality rate (per 100000) is ranging from 1 to 6 in unit increments and 6 to 7.7 in increments of 1.7. Figure 2b is a set of five maps of Switzerland depicting age-standardized excess mortality rate due to cold in years, including 1969 to 1978, 1979 to 1988, 1989 to 1998, 1999 to 2008, and 2009 to 2017. A scale depicting standardized excess mortality rate (per 100000) is ranging from 50 to 110 in increments of 15 and 110 to 137 in increments of 27.

Age-standardized (std.) excess mortality rate for heat (A) and cold (B) by decade per 100,000 people.