
Figure 3.
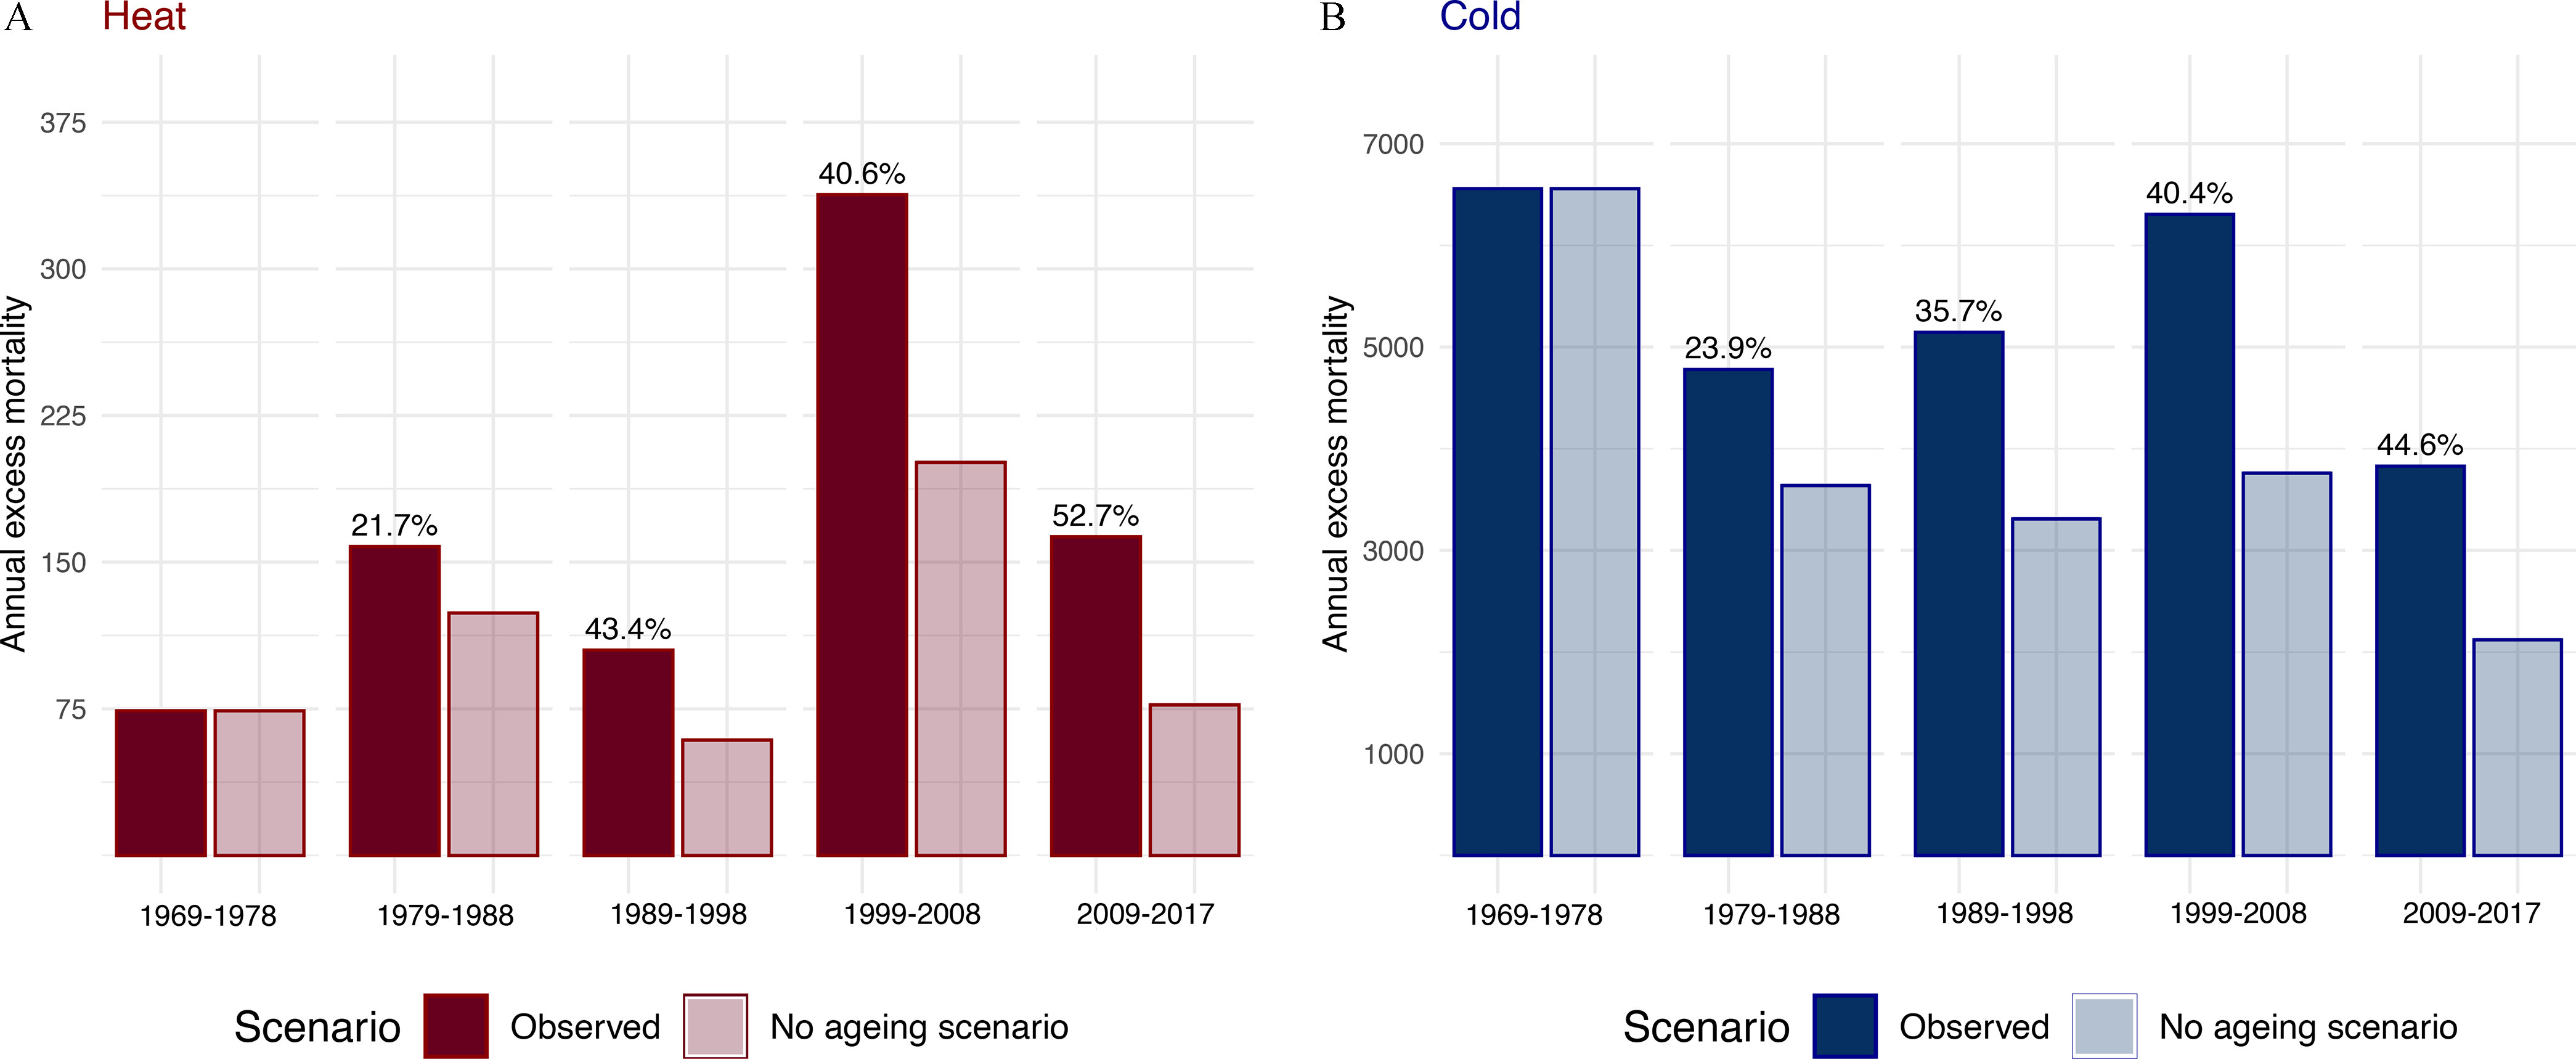
Panels A and B compare the observed annual heat- and cold-related number of excess deaths, respectively, with the excess mortality estimated in a scenario of no population aging. The percent reported on the “observed” bars illustrate the corresponding decade-specific percent difference between the observed annual heat and cold-related excess mortality and the scenario of no population aging in comparison with 1969–1978. The point estimates and difference percent between the observed and counter-factual scenario are provided in Table S9.