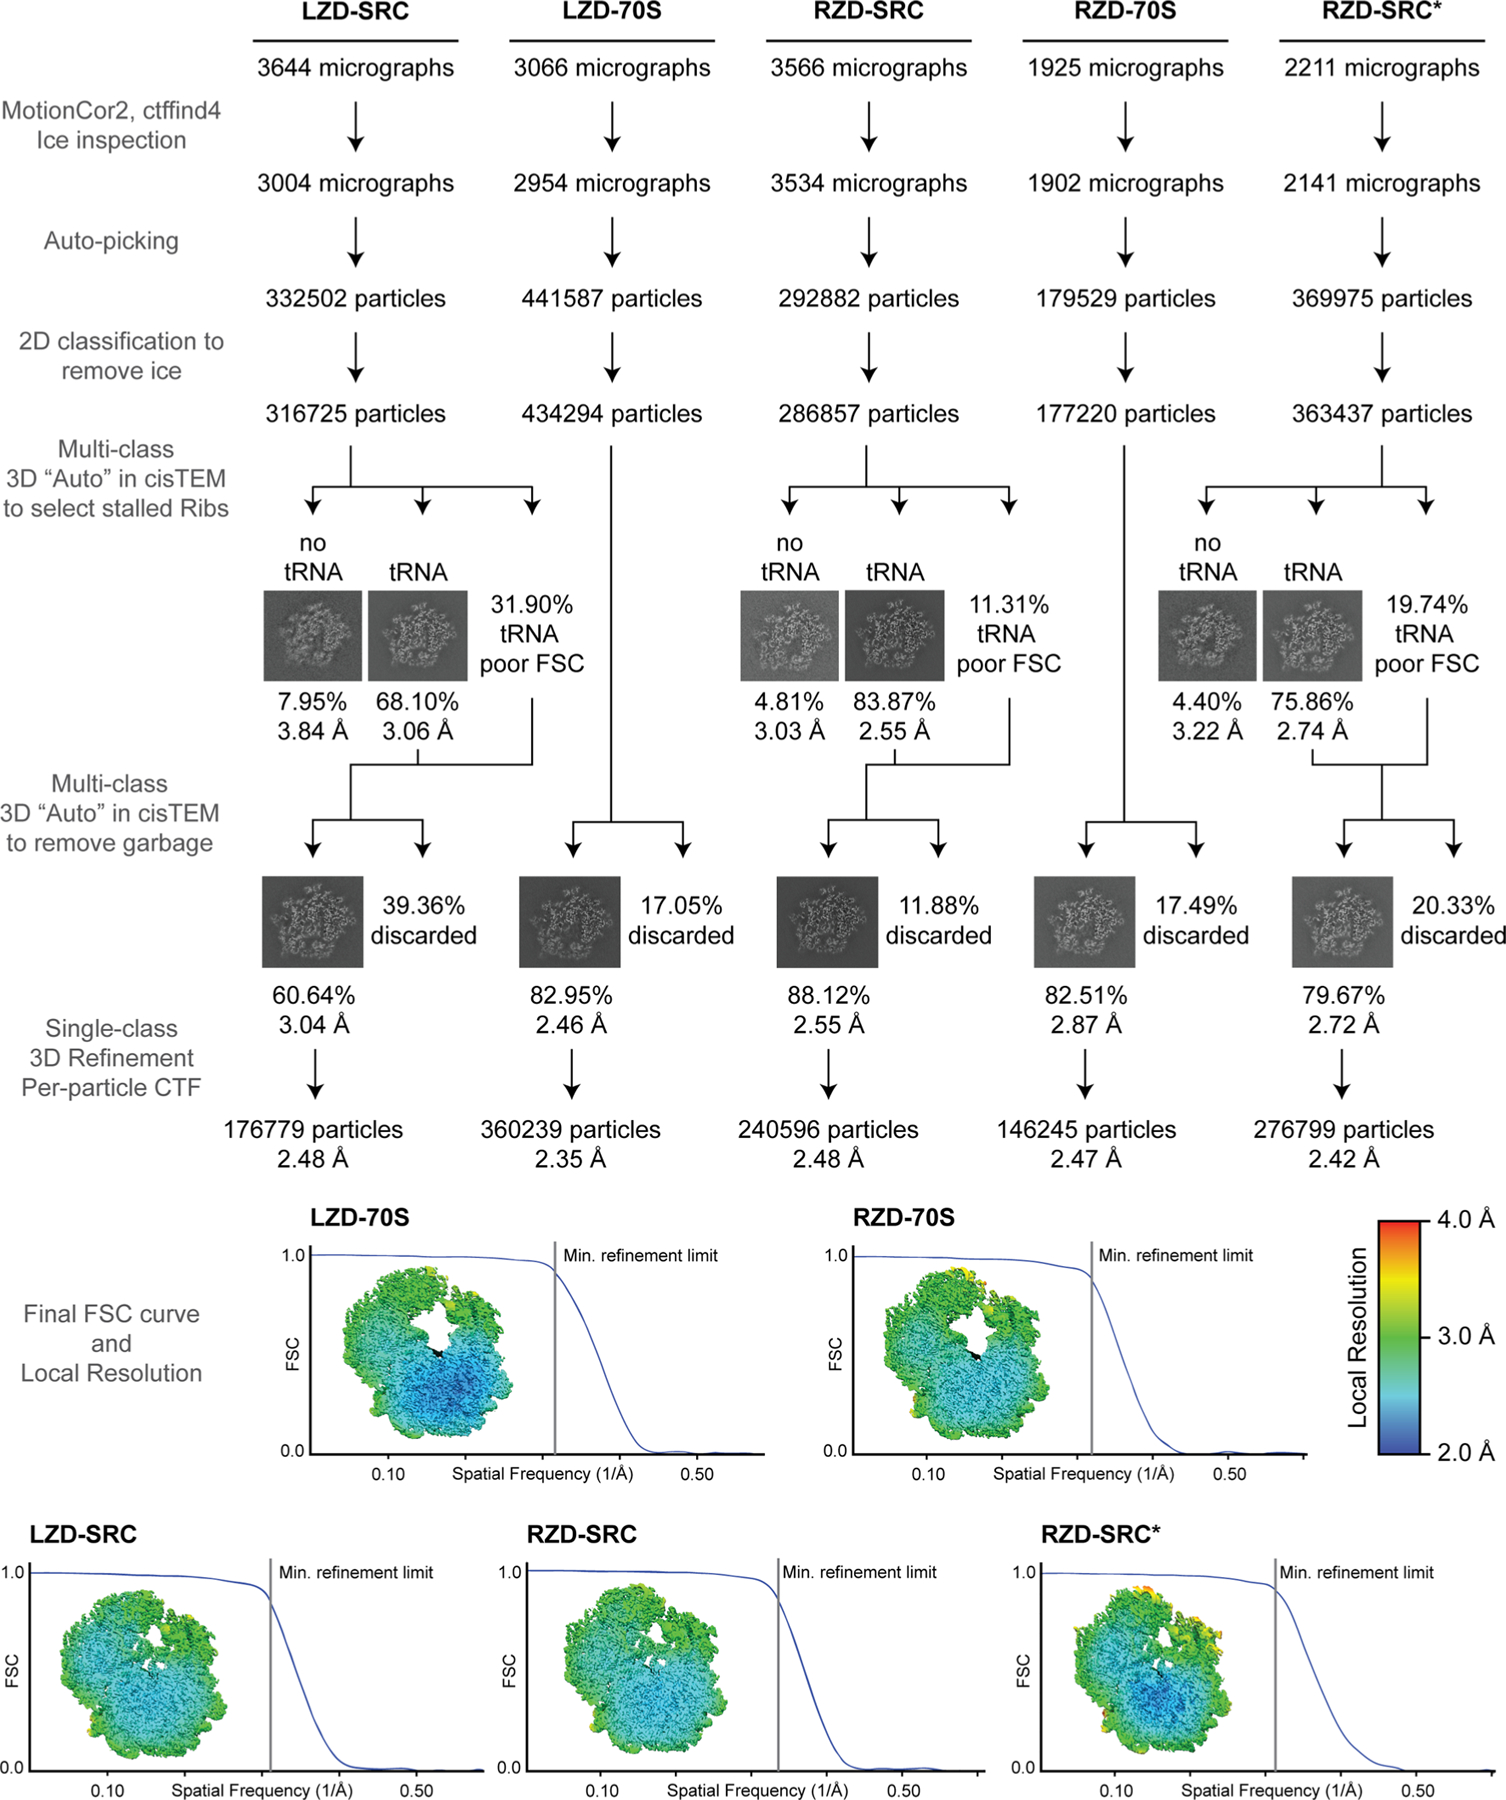
Extended Data Fig. 1 |. Processing workflow, classification tree, FSC curves, and local resolution estimation for each map.

Micrographs were CTF corrected and curated for ice quality, followed by unsupervised particle picking. 2D classification was used to remove residual ice particles, with all others subjected to multi-class 3D classification and refinement approaches to remove particles without tRNA (for SRCs) and select for good particles. Final FSC curves are presented along with center-slab representation of local resolution. All steps were carried out within the cisTEM (v1.0.0-beta) framework with the exception of local resolution estimation, which used the Relion (v3.1.2) implementation.
