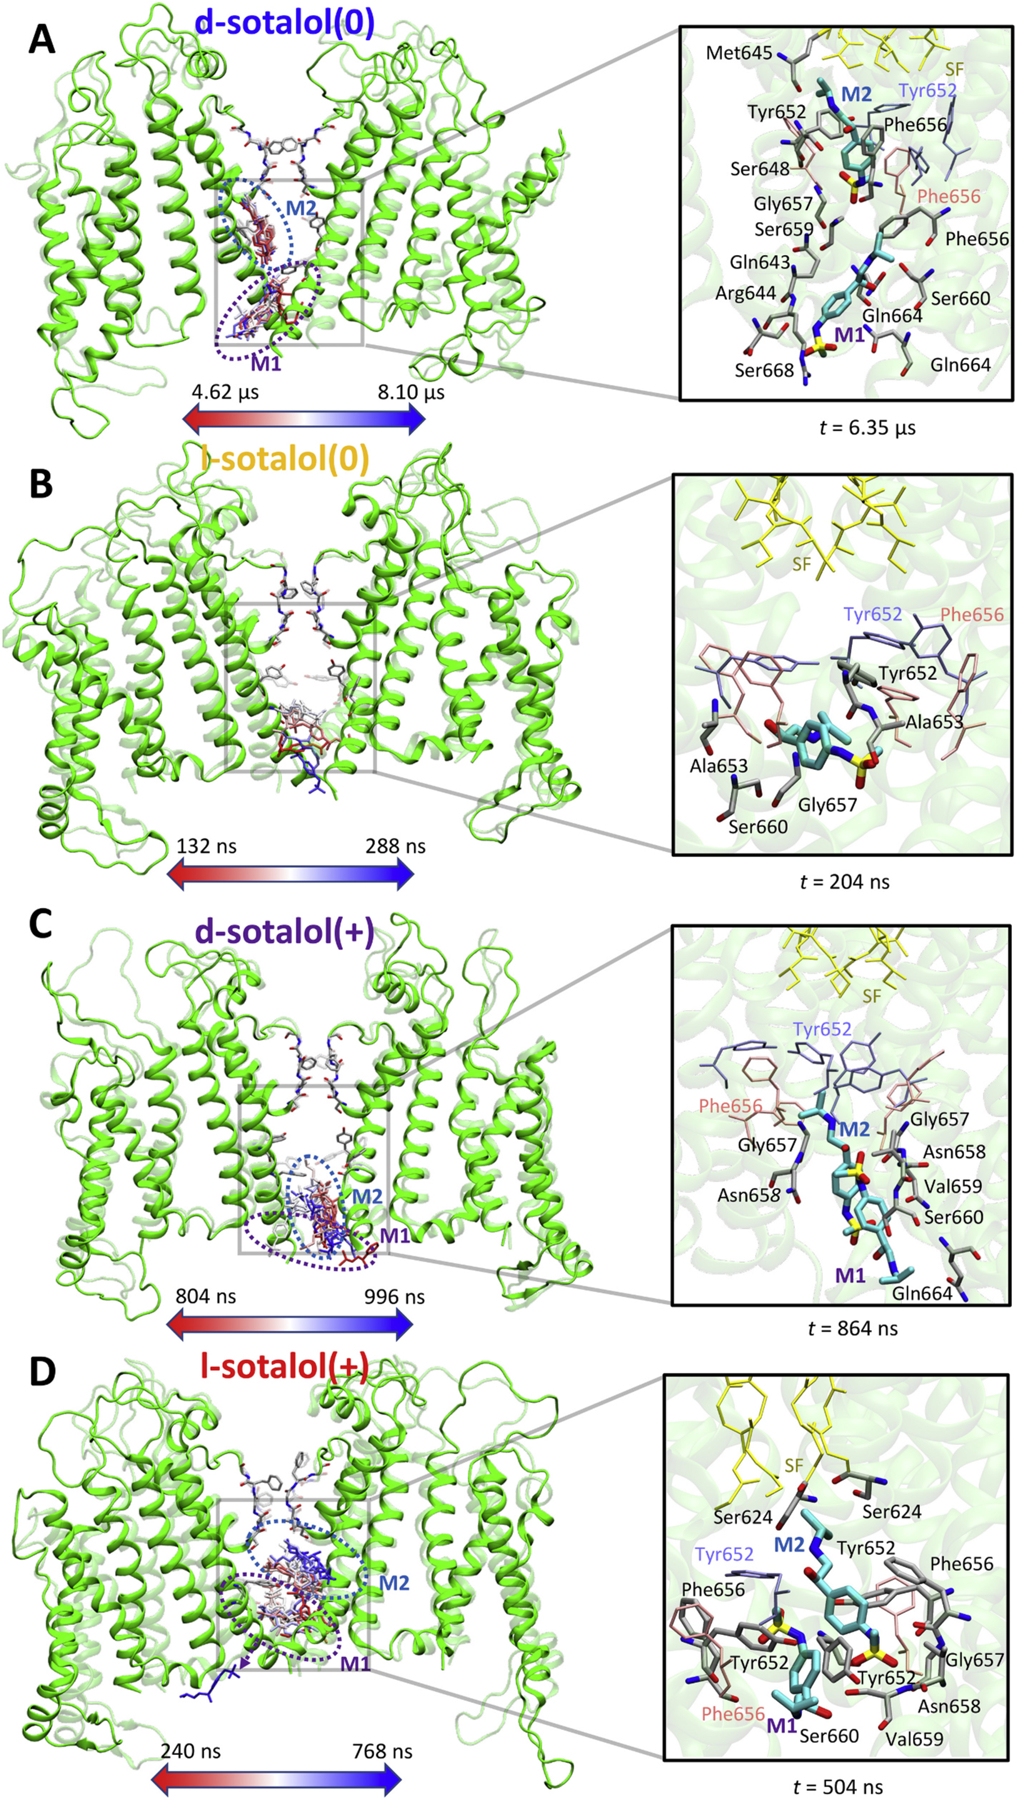
Fig. 2.

Binding sites of neutral(0) or cationic(+) d- or l-sotalol around the hERG channel from 8.1 μs long unbiased MD simulations. (A) d-sotalol(0); (B) l-sotalol(0); (C) d-sotalol(+); (D) l-sotalol(+). Left panels: Time-series rendering for binding of one or two sotalol molecules (labeled M1 and M2) within the hERG pore. Sotalol molecules in the frames are shown by colored sticks from the beginning (red) to the end (blue) of each representative binding event. The hERG channel is shown in the initial (transparent green ribbons) and the final (solid green ribbons) conformations. Canonical drug interacting residues Phe656 and Tyr652 as well as selectivity filter (SF) residues are shown as solid or transparent atom-colored ribbons (C – gray, O – red, N – blue). Right panels: Representative binding poses adopted by sotalol molecules (thick atom-colored sticks with C – cyan, S – yellow, others as above) in the hERG channel pore. Interacting hERG residues (within 3.5 Å of any non-H atoms of the drug) are shown as thick atom-colored sticks (C – gray, others are as above). Non-interacting hERG residues Phe656, Tyr652 as well as its SF residues are shown as thin pink, blue and yellow sticks. Hydrogen atoms are not shown for clarity. (For interpretation of the references to colour in this figure legend, the reader is referred to the web version of this article.)
