
Fig. 3.
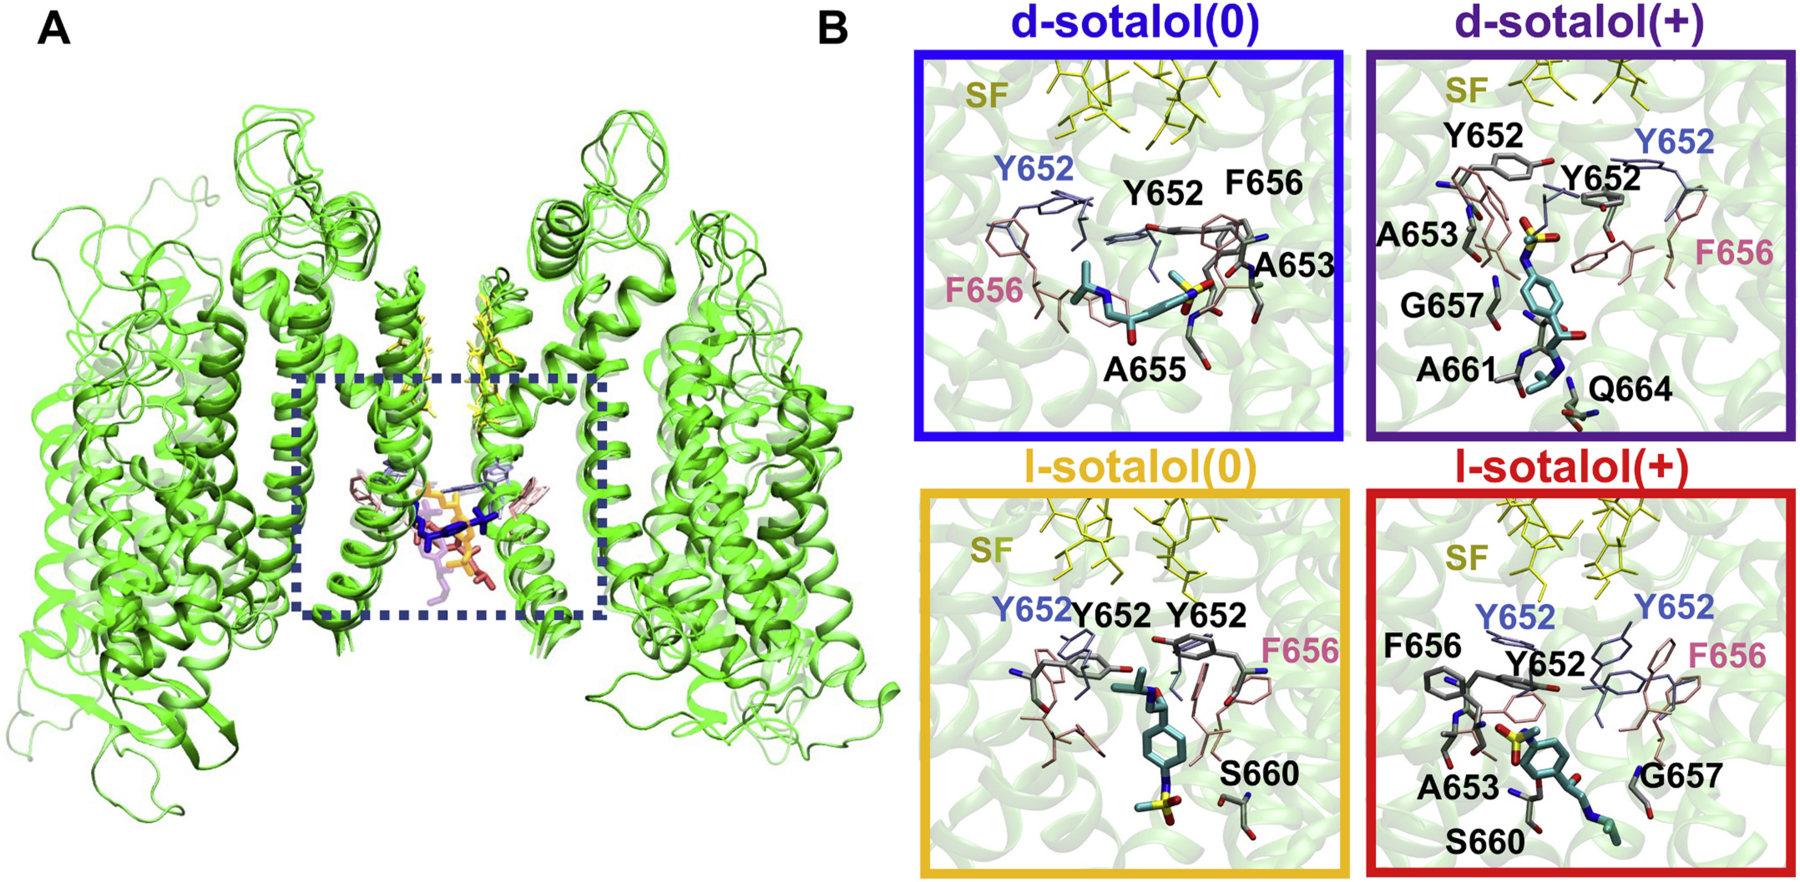
Representative binding poses of neutral(0) and cationic(+) d- and l-sotalol to open hERG channel obtained from US-MD simulations. (A) hERG channel – bound sotalol structures from four US-MD runs corresponding to free energy minima for each simulation are superimposed and represented by different shades. Two opposite chains of the open-state hERG channel structures are shown as green ribbons. Bound sotalol molecules are shown as thick colored sticks: d-sotalol(0) – blue, d-sotalol(+) – purple, l-sotalol(0) – orange, and l-sotalol(+) – red. hERG SF residues are shown as yellow thin sticks, and canonical binding residues F656 and Y652 as thin pink and ice-blue sticks. (B) Close-up views of sotalol hERG binding poses corresponding to a dotted black box location in panel A. Sotalol molecules are shown as thick atom-colored sticks (C – cyan, N – blue, O – red, S – yellow). hERG channel is shown by transparent green ribbons with residues within 3.5 Å of sotalol non‑hydrogen atoms shown by thin atom-colored sticks (C – gray, N – blue, O – red). Non-interacting SF, F656 and Y652 residues are shown by thin colored sticks as in panel A. Hydrogen atoms are not shown for clarity. Box border coloration in panel B corresponds to coloration of each isoform of d- and l-sotalol in panel A. (For interpretation of the references to colour in this figure legend, the reader is referred to the web version of this article.)