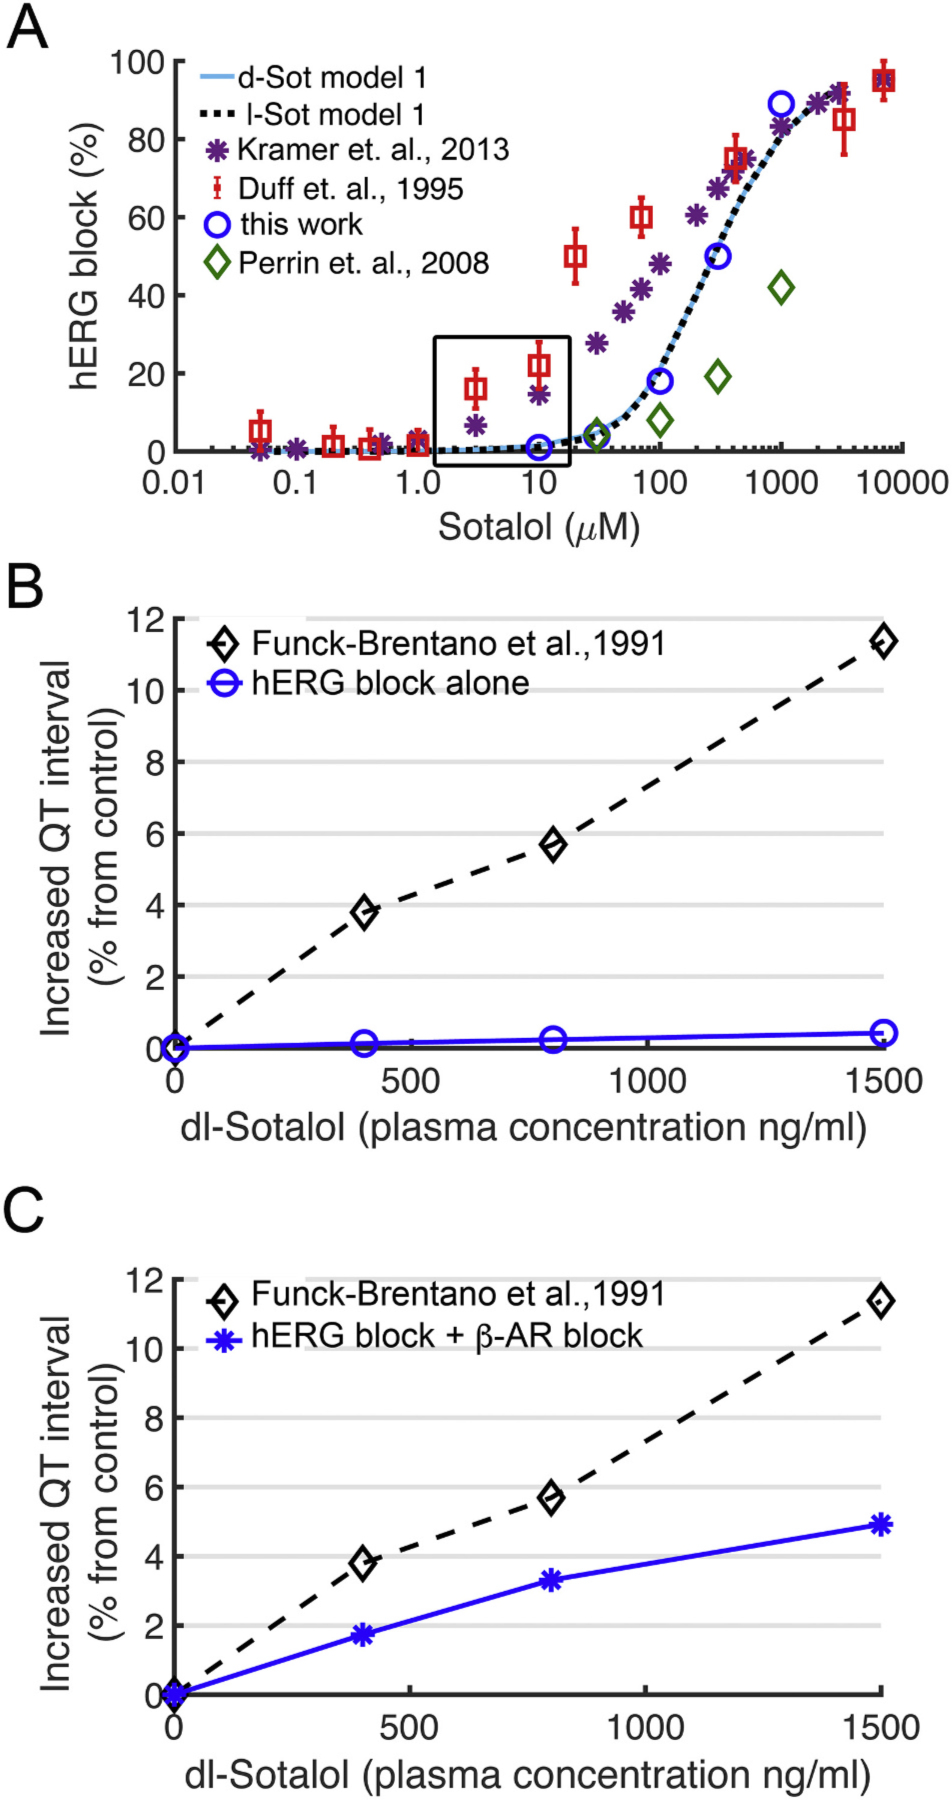
Fig. 6.

Concentration dependent block of hERG and QT prolongation by sotalol. (A) Experimentally measured dose dependent inhibition of hERG channel by sotalol (colored symbols) and model 1 optimization based on experiments by us and others from expressed channels in mammalian cell lines for d-sotalol (solid light-blue line) and for l-sotalol (dashed black line). Black box indicates therapeutic plasma concentrations. Experimental data are from: Kramer et. al, 2013 – ref. [117]; Duff et. al., 1995 – ref. [80]; Perrin et. al., 2008 – ref. [79]; and this work – see Fig. 5. (B) Concentration dependent increase in QT intervals by d,l-sotalol with hERG channel block alone (blue circles) compared to clinical data (black diamonds) from ref. [82]. (C) During sympathetic stimulation via concurrent ISO 1 μM application, simulations showed a concentration dependent increase in QT interval by d,l-sotalol dependent hERG block and βAR blockade (blue asterisks) compared to clinical data from ref. [82] (black diamonds). (For interpretation of the references to colour in this figure legend, the reader is referred to the web version of this article.)
