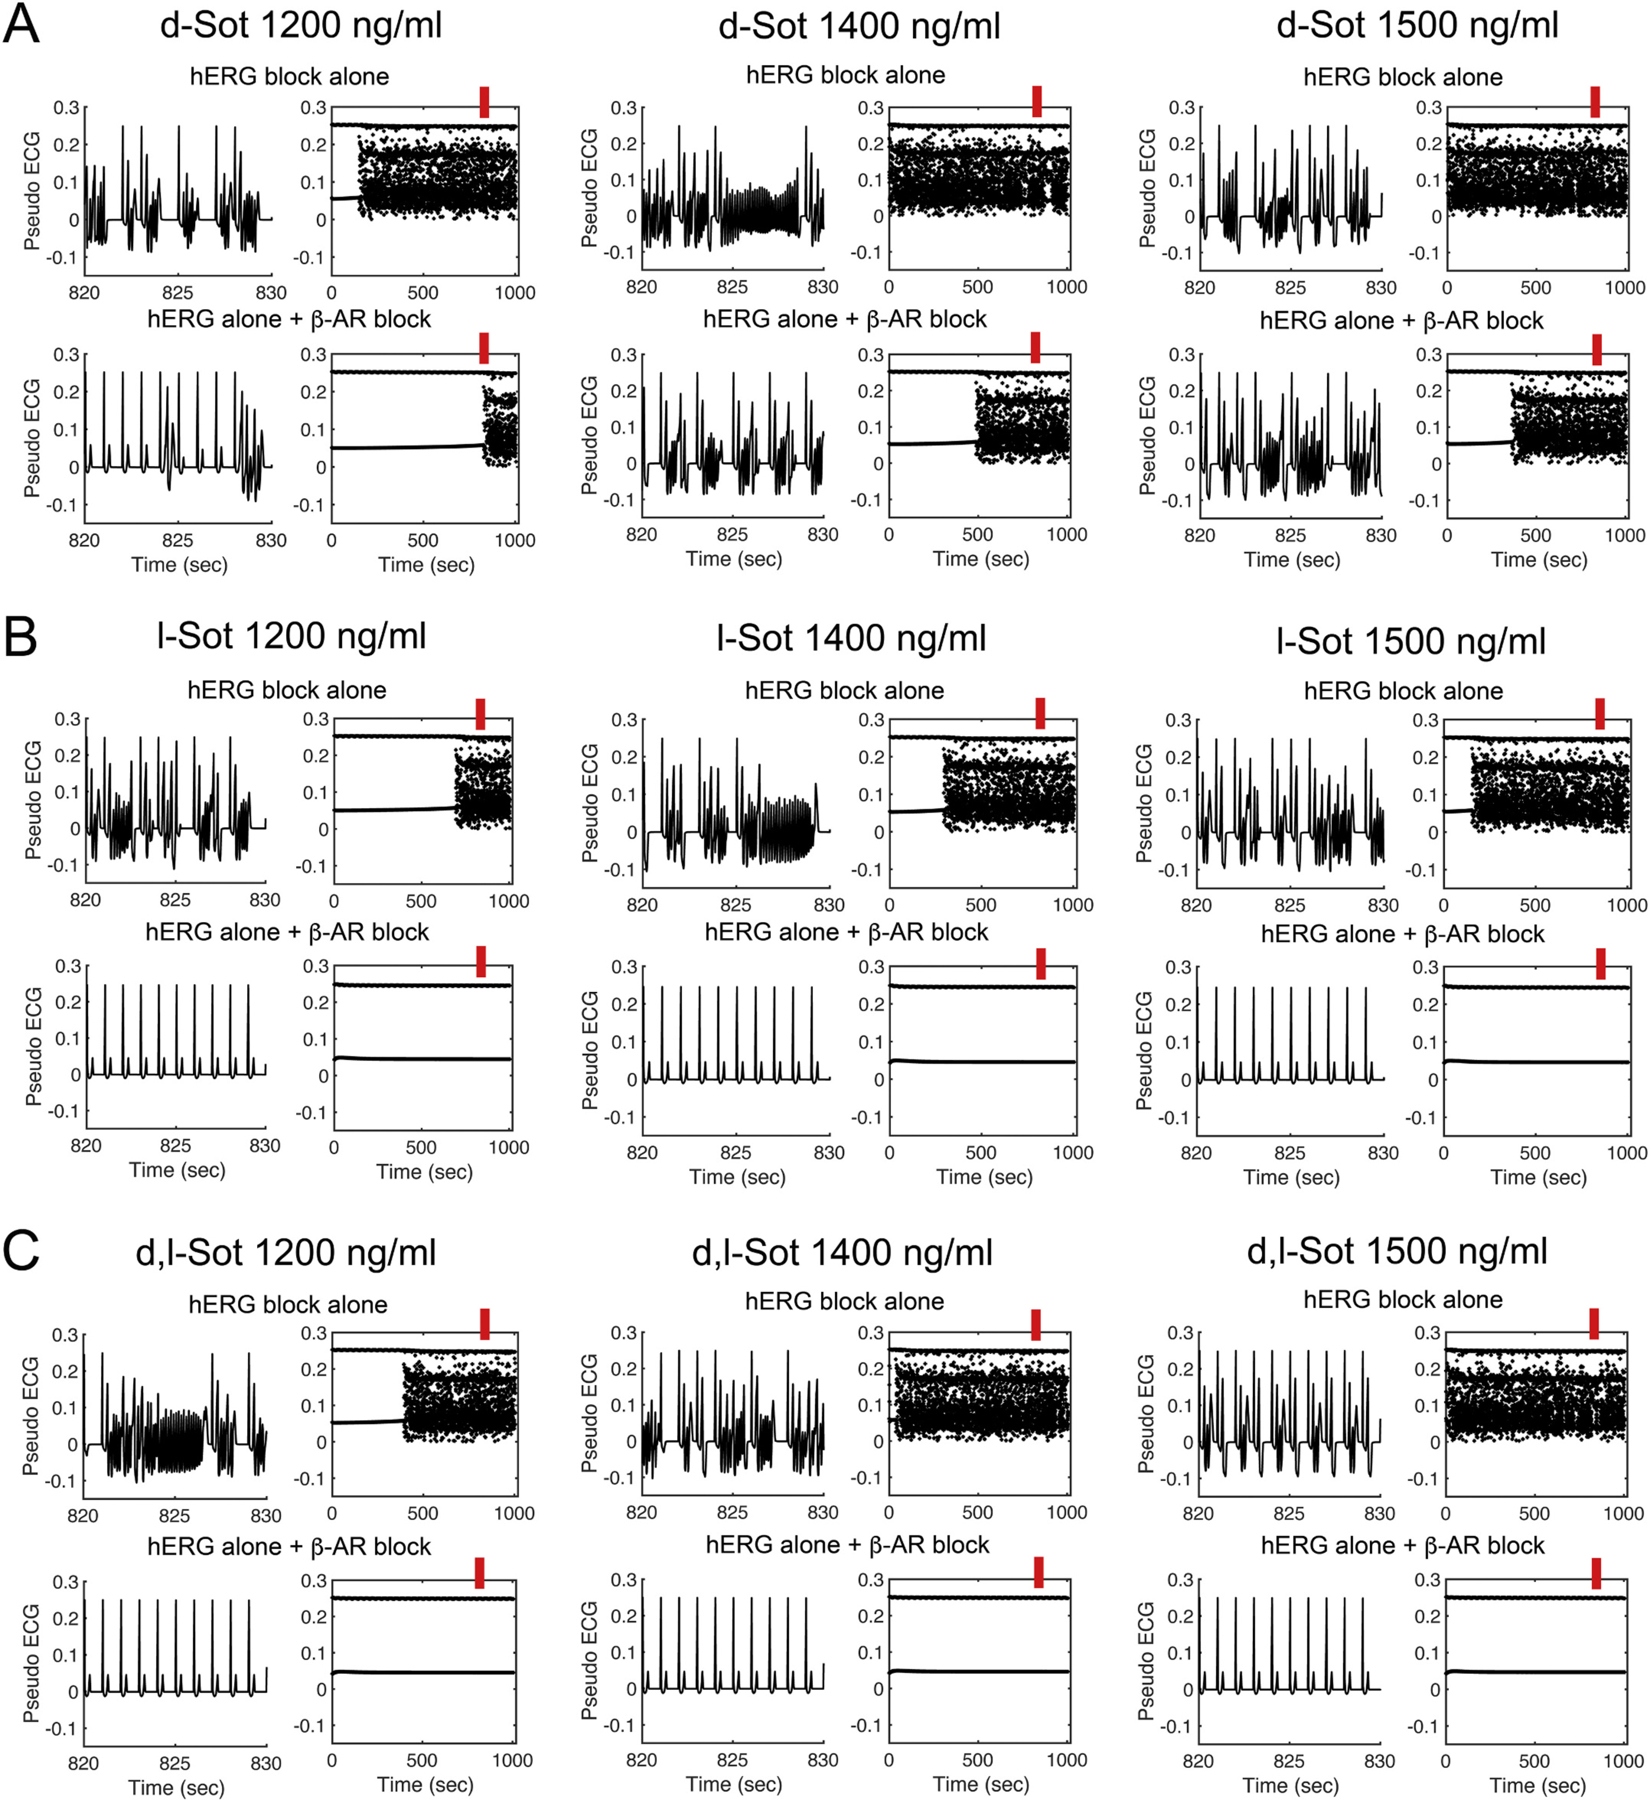
Fig. 8.

Model prediction of sotalol effects on hERG block and βAR blockade during ISO 1 μM application. The timecourse of pseudo ECGs of model 2 between 820 and 830 s (red bars) at three sotalol plasma concentrations are shown in the left columns of every panel. The peaks of R and T waves are plotted during a 1000 s long simulation timecourse as summary data shown in the right columns of every panel. (A) The predicted additive effect of d-sotalol to block hERG and βAR did not abolish EADs at any tested concentrations. (B) l-sotalol with both hERG and βAR blockade abolished EADs at 1200 ng/ml and higher concentrations. (C) Similar to l-sotalol, racemic d,l-sotalol 1200 ng/ml removed EADs. (For interpretation of the references to colour in this figure legend, the reader is referred to the web version of this article.)
