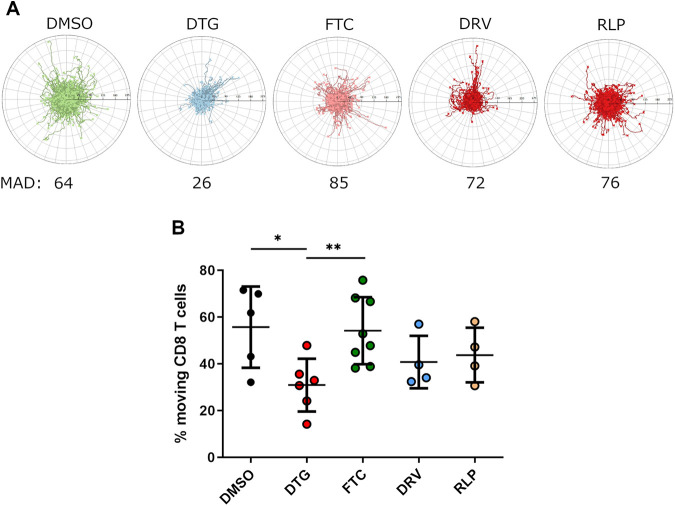
FIG 2.
Assessment of the mobility of CD8 T cells treated with different ARTs individually. Isolated CD8 T cells from HIV-negative individuals (n = 8) were cultured in the presence of DMSO or different ART regimens at bio-active plasma concentrations for 1 day and afterwards stimulated with SDF-1α. Migration of cells were recorded via video microscopy for a period of 3 h with one image taken every 15 s. (A) The panel shows the exemplary trajectory plots (track origins set to 0.0) for the respective conditions generated using the ACAS autotracking tool. The scale bar indicates the distance between the ticks of the trajectory plots. The mean accumulated distance (MAD) is shown in µm. (B) Overall reduced percentage of moving CD8 T cells which were treated with DTG (red circles, n = 6) compared to DMSO (black circles, n = 5), FTC (green circles, n = 8), DRV (blue circles, n = 4), and RLP (yellow circles, n = 4). Chart shows the mean value ± SD. Mann-Whitney nonparametric statistical tests were applied for comparison, (*P < 0.05; **P < 0.01).

