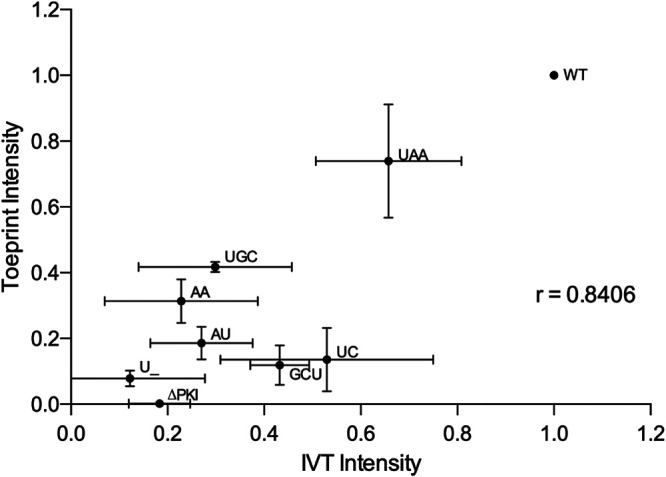
FIG 6.

Correlation between the translation activities and toeprint intensities of hinge mutant IAPV IGR IRESs. The mean values of the translation activities and mean intensities of the toeprint AA6628 observed in LTM-treated RRL for each mutant IRES from Fig. 1C and 5A, respectively. Vertical and horizontal error bars represent standard deviations of toeprinting intensities (Fig. 4A) and relative IRES translational activities (Fig. 1C), respectively. Linear regression analysis was performed, and the Pearson correlation coefficient was calculated. P value is two-tailed with 95% confidence interval.
