. 2020 Nov 13;12(3):983–992. doi: 10.1039/d0sc05064d

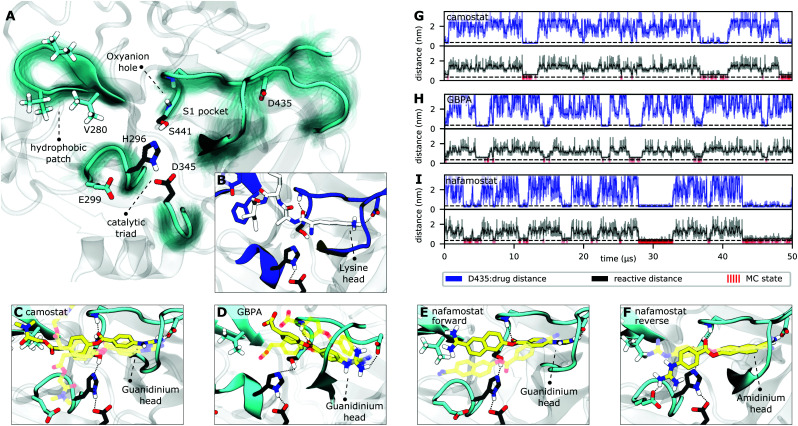
Fig. 3. TMPRSS2 structure and Michaelis complex with camostat, its metabolic product GBPA, and nafamostat. (A) Active site overview of the catalytic domain of TMPRSS2. Protein flexibility is shown by cyan halo, catalytic triad is shown in black. (B) Pre-catalytic binding mode shown at example of trypsin peptide recognition (PDB ID 4Y0Y,34 peptide displayed in white). (C–F) Representative structures of camostat (C), GBPA (D), and nafamostat (E and F) in complex with TMPRSS2. All drugs (yellow licorice representation) bind into the S1 pocket of TMPRSS2, in (C–E) with their guanidinium heads interacting with D435, while (F) shows a reverse binding mode with nafamostat binding with its aminidinium head. (G–I) Markov model simulations of minimal distance to D435 (at the S1 pocket, blue), reactivity coordinate (black), and reactivity state (i.e. when trajectory is in MC state, red) for camostat (G), GBPA (H), and nafamostat (I).

Fig. 3