
Figure 1.
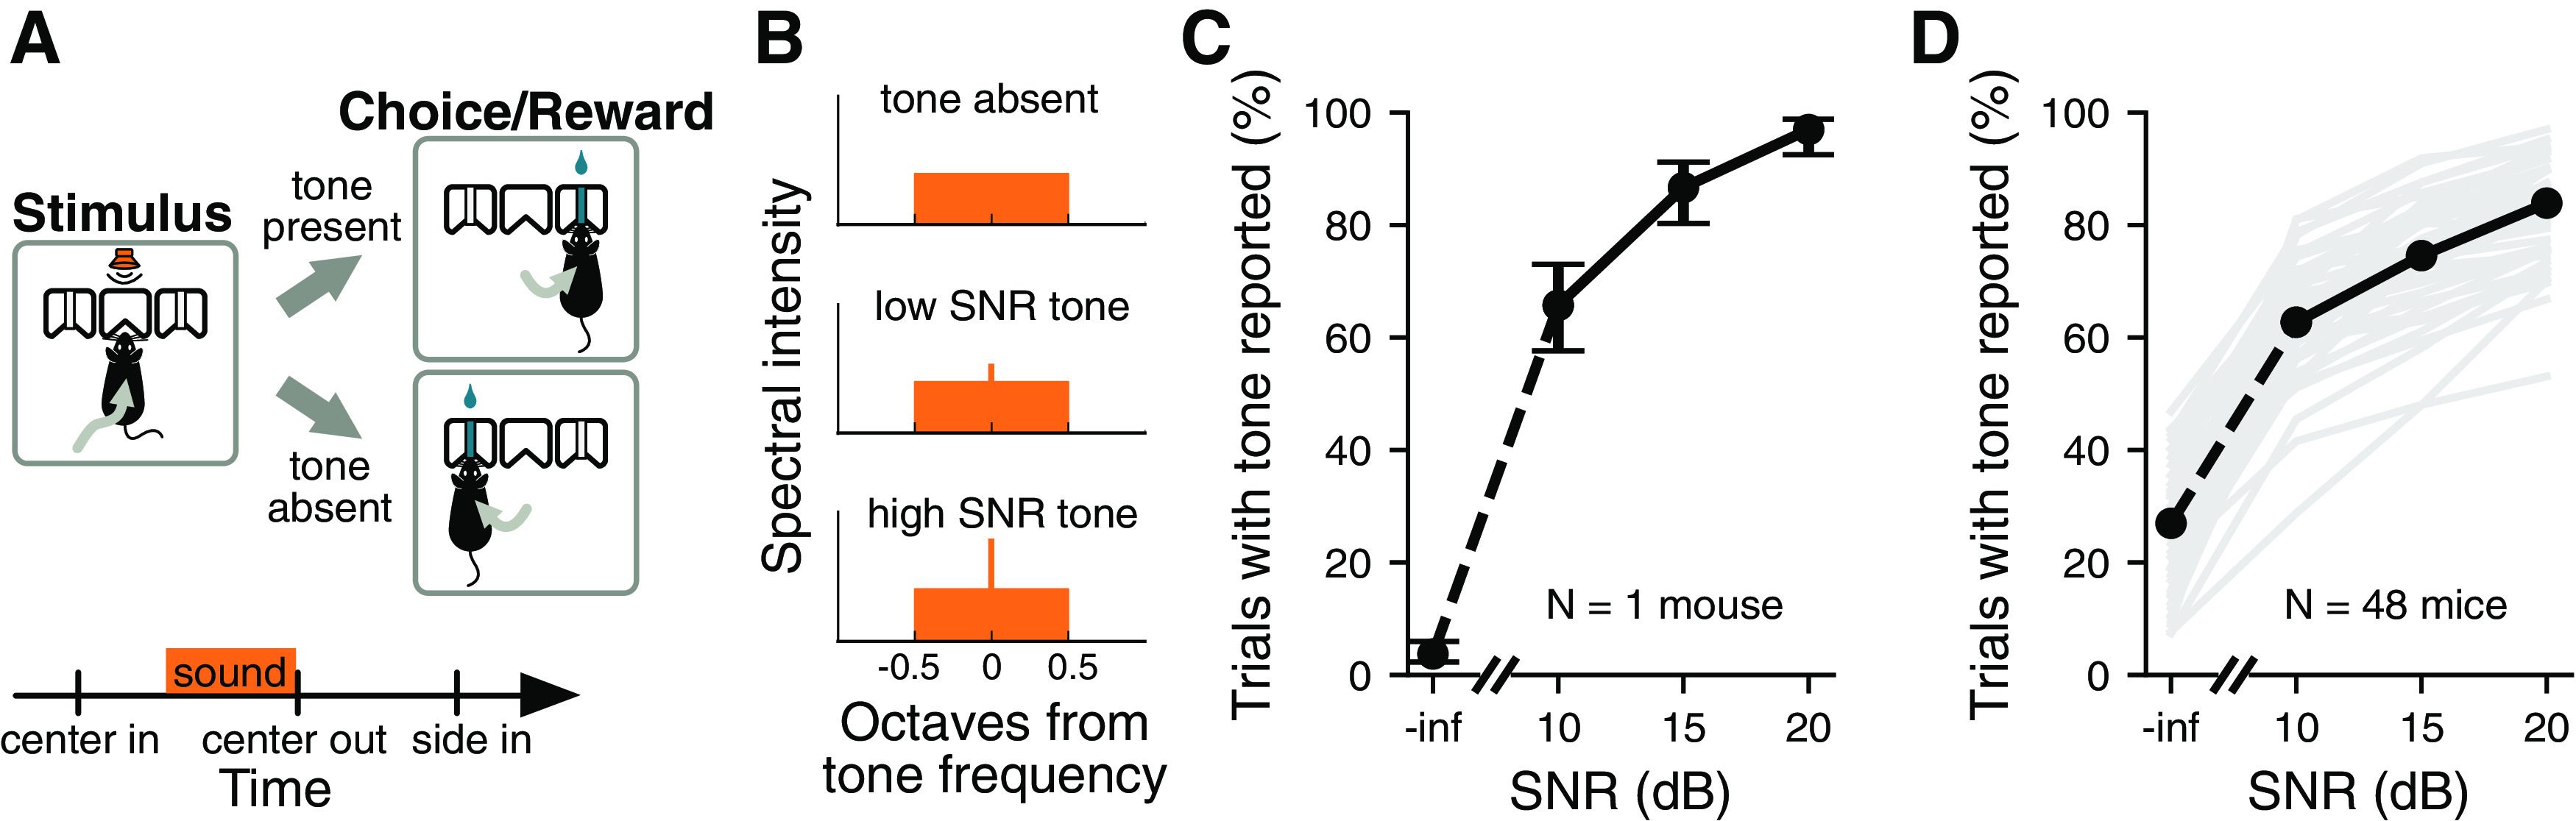
Performance in a signal detection task. A, Schematic of the signal detection task. Mice had to correctly report the presence or absence of a pure tone signal to obtain a reward. B, Example frequency spectra of sounds used during the signal detection task. C, Example psychometric curve showing the performance of one mouse during one behavior session. Performance is averaged over all masker bandwidths presented. Error bars show 95% confidence intervals. D, Median psychometric curve (black line) for mice trained in the signal detection task (N = 48 mice). Psychometric curves for individual mice are shown in gray. Trials are pooled across multiple sessions. Performance is averaged over all masker bandwidths presented.