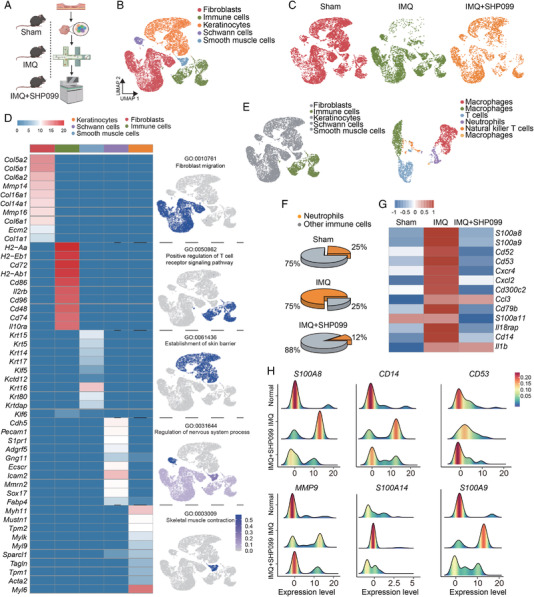
FIGURE 5.

Single‐cell RNA sequencing reveals that the inhibition of SHP2 can decrease neutrophil infiltration. (A) Schematic representation of the experimental procedure. (B) Unbiased clustering reveals five cellular clusters. (C) Cell atlas of mice skin tissue. (D) Heat map image of the functional gene set and cell atlas of each cell population. (E) Unbiased clustering of immune cells. (F) Pie chart of the proportion of neutrophils to immune cells. (G) Heat map image of neutrophil‐related functional gene sets. (H) Summit plot of neutrophil‐related functional genes
