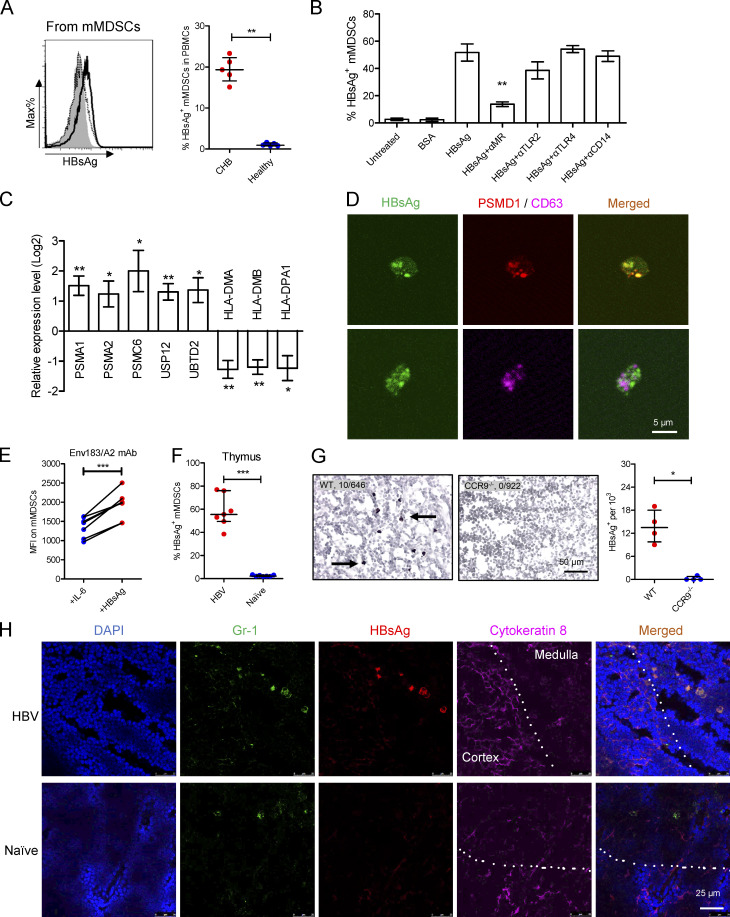
Figure 4.
mMDSCs transfer HBsAg to the thymic medulla. (A) Intracellular staining of HBsAg in CD14+ myeloid cells from CHB subjects (solid, n = 5) or healthy subjects (dotted, n = 5). (B) Detecting HBsAg in HBsAg-induced mMDSCs in the presence of blocking antibodies (n = 5, 20 μg/ml). (C) Levels of PSMA1, PSMA2, PSMC6, UPS12, UBTD2, HLA-DMA, HLA-DMB, and HLA-DPA1 in HBsAg-induced mMDSCs (n = 5). (D) Colocalization of intracellular HBsAg with PSMD1 or CD63 in mMDSCs. (E) Detecting the Env183/A2 complex on IL-6 or HBsAg-induced HLA-A2+ mMDSCs with TCR-like antibody (n = 7). (F) Staining HBsAg in endogenous thymic mMDSCs from HBV-persistent HDI mice or naive mice (n = 7). (G) IHC staining HBsAg in thymi from WT or CCR9−/− HBV-persistent HDI mice. Arrows indicate the positive signaling in the IHC staining (brown, 400X, four views). (H) Localization of endogenous mMDSCs and HBsAg in the thymi of HBV-persistent HDI mice. Nucleus (DAPI), mMDSCs (Gr1), HBsAg, thymic cortex (cytokeratin-8), IF, triplicate. Dotted lines indicate the border of thymic cortex and medulla. *, P < 0.05; **, P < 0.01; ***, P < 0.001.

