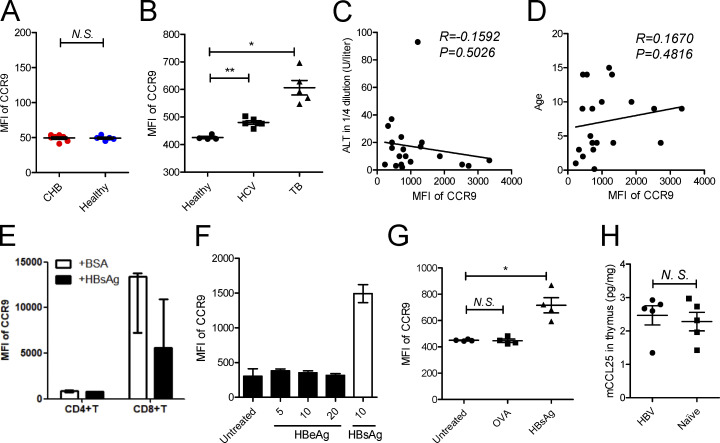
Figure S2.
Analyzing the expression of chemokine receptors on mMDSCs. (A) Level of CCR9 on total CD14− cells in CHB patients (n = 7) and healthy donors (n = 5). (B) Level of CCR9 on CD14+ myeloid cells in blood from chronic HCV and TB infection. (C and D) Correlation between serum ALT (C) or age (D) with median fluorescence intensity (MFI) of CCR9 on mMDSCs from CHB patients (age < 20, n = 20). (E) Detection of CCR9 on CD4+ or CD8+ T cells after stimulating healthy PBMCs with HBsAg (n = 3). (F) Detecting CCR9 on mMDSCs after stimulation with HBeAg in different concentrations or HBsAg (μg/ml). (G) Detecting CCR9 after stimulation with OVA or HBsAg. (H) Detection of CCL25 in the thymus from HBV-persistent HDI mice or naive mice (n = 5). *, P < 0.05; **, P < 0.01.

