Figure 4.
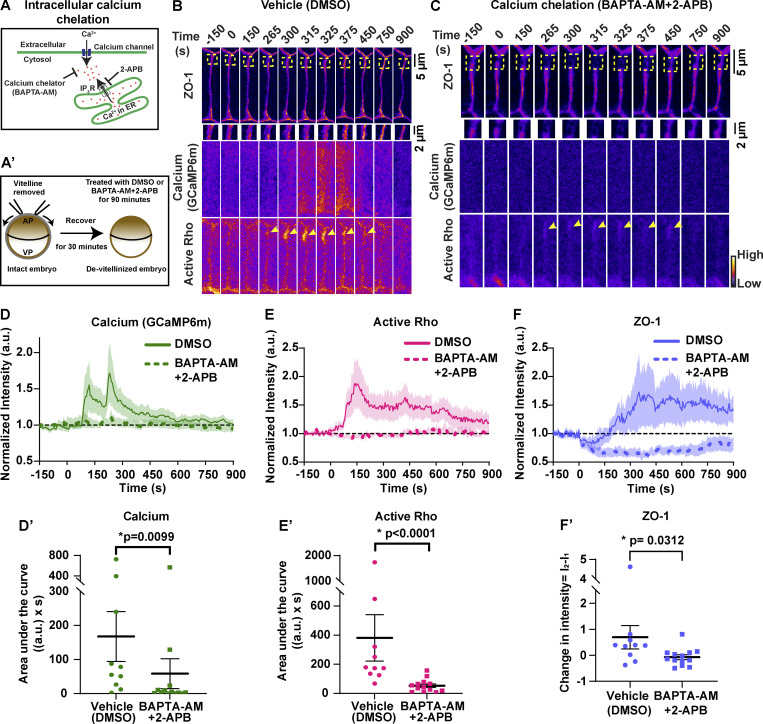
Intracellular calcium flash is required for Rho flare activation and ZO-1 reinforcement. (A) Schematic of cytosolic calcium chelation using BAPTA-AM and blocking IP3R-mediated calcium release from the ER using 2-APB. (A′) Schematic showing BAPTA-AM and 2-APB treatment after removal of vitelline envelope. (B and C) Time-lapse images (FIRE LUT) of BFP-ZO-1, calcium (GCaMP6m), and active Rho (mCherry-2xrGBD). Embryos were treated with 0.5% DMSO (vehicle; B) or 20 µM BAPTA-AM and 100 µM 2-APB (calcium chelation; C). Calcium chelation resulted in more severe ZO-1 breaks (yellow boxes, enlarged below) and decreased Rho activity (yellow arrowheads) at the site of ZO-1 loss. Time 0 s represents the start of ZO-1 decrease. (D–F) Graphs of mean normalized intensity of calcium (GCaMP6m; D), active Rho (E), and ZO-1 (F) at the site of ZO-1 loss over time in vehicle (DMSO, solid lines) or calcium chelation (BAPTA-AM + 2-APB, dashed lines) embryos. Shaded region represents SEM. DMSO: n = 10 flares, 7 embryos, 7 experiments; BAPTA-AM + 2-APB: n = 13 flares, 8 embryos, 8 experiments. (D′–F′) Area under the curve (AUC) for calcium (D′) and active Rho (E′) was calculated from D and E, respectively. Scatter plot of change in ZO-1 intensity (F′) was calculated from F. I1 and I2 represent average intensity of ZO-1 from individual traces from times 0–50 s and 400–450 s, respectively. Error bars represent mean ± SEM; significance calculated using Mann–Whitney U test.

